
Now that you know what Canva is, it’s time to get started with your journey on creating fabulous and eye-catching graphic designs.
But, despite the good feedbacks you’re hearing, you won’t believe it if in the first place you don’t know where to find every tool you’re going to need later on.
What more if you don’t even know the basic canva design ideas. However, you need not fret about this.
You’re in luck, as we’re about to unlock the mystery to the most important (Yes! It is!) component or tool in Canva — the Elements menu.
But, how can you edit an element in Canva?
How to Edit an Element in Canva
Elements in Canva include lines, shapes, graphics, frames, charts, tables, and grids. Edit them by changing the colors through the color picker box. If there’s none, it’s non-editable. Position, rotate and copy the elements according to your design. You can also resize, crop, and flip the elements if needed.
Editing Canva Elements: Basics You Should Master
If you’re that eager to learn how to begin designing in Canva, you’ll need to master editing the elements you can find under the Elements tab.
So, to begin the process, you first need to enter the editor page after creating a new design file or opening an existing file.
Once you’re on the page, head over to the left panel and click on the Elements menu. You will then see the various elements listed out.
These are the elements you can find in Canva’s Elements menu:
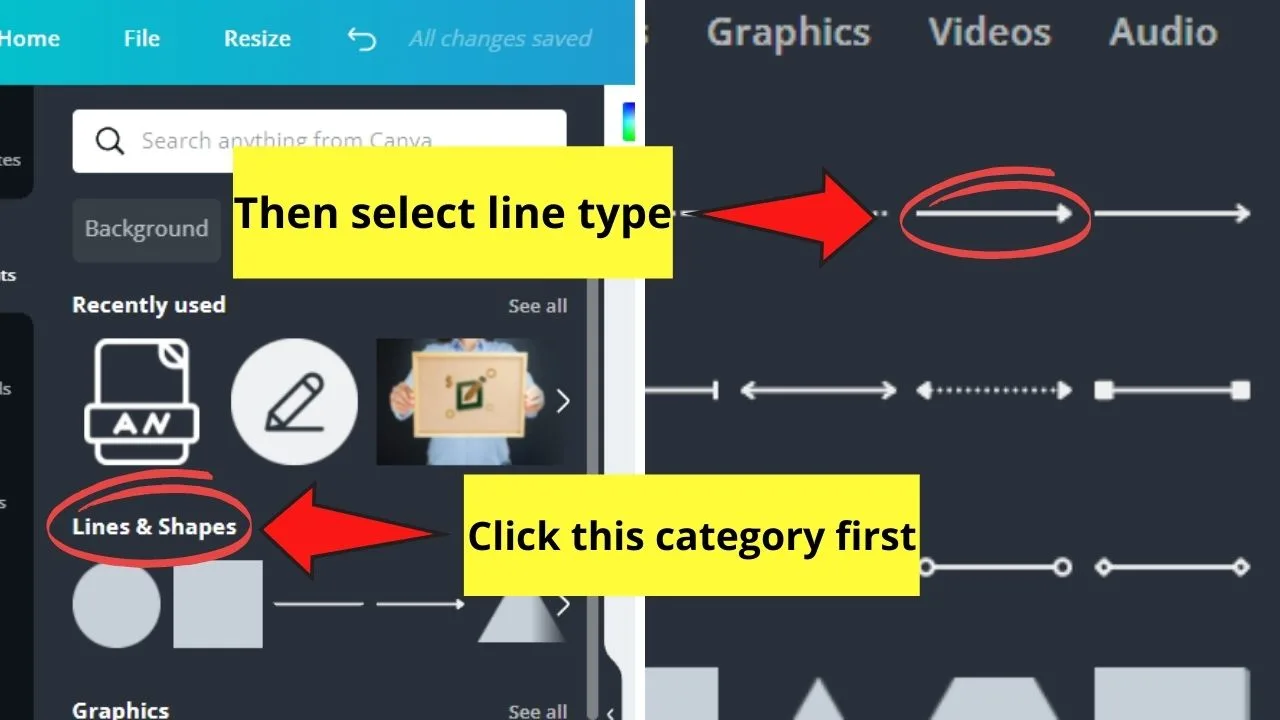
- Lines and Shapes
- Graphics
- Frames
- Charts
- Tables
- Grids
Despite the various choices of elements you have in Canva, not all of them are editable.
Meaning, there are some elements that you can customize, and there are some that you cannot customize.
Despite this major difference, you can flip, rotate, crop, and resize elements according to how you want them to look on your design.
At some point, you can even add fun animations through the Animate button on the editor toolbar.
Lines and Shapes
If you’re a Canva user for quite some time now, you’ll notice that these two categories have been lumped together.
Despite this, we’ll get to the bottom of how we can edit lines and shapes in Canva. For a more detailed tutorial, check out how to make lines thinner in Canva.


Lines
Step 1: Select a line type from the gallery. You can also add a line by pressing the L key to directly add one on the canvas.

If this Canva keyboard shortcut isn’t enough, learn the 11 most useful Canva keyboard shortcuts on this site to have a headstart
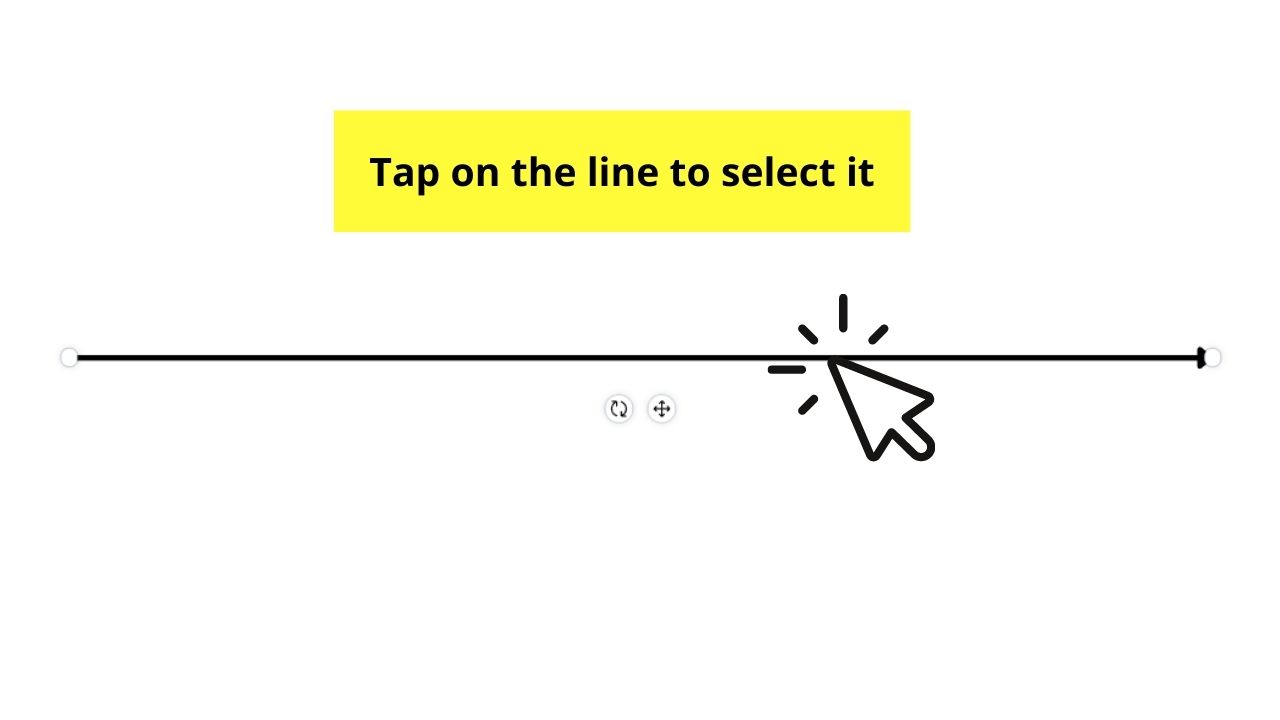
Step 2: Click on the line to highlight it. The line editor toolbar will then appear above the canvas.

Step 3: On the editor toolbar, click on the options available to customize your line.
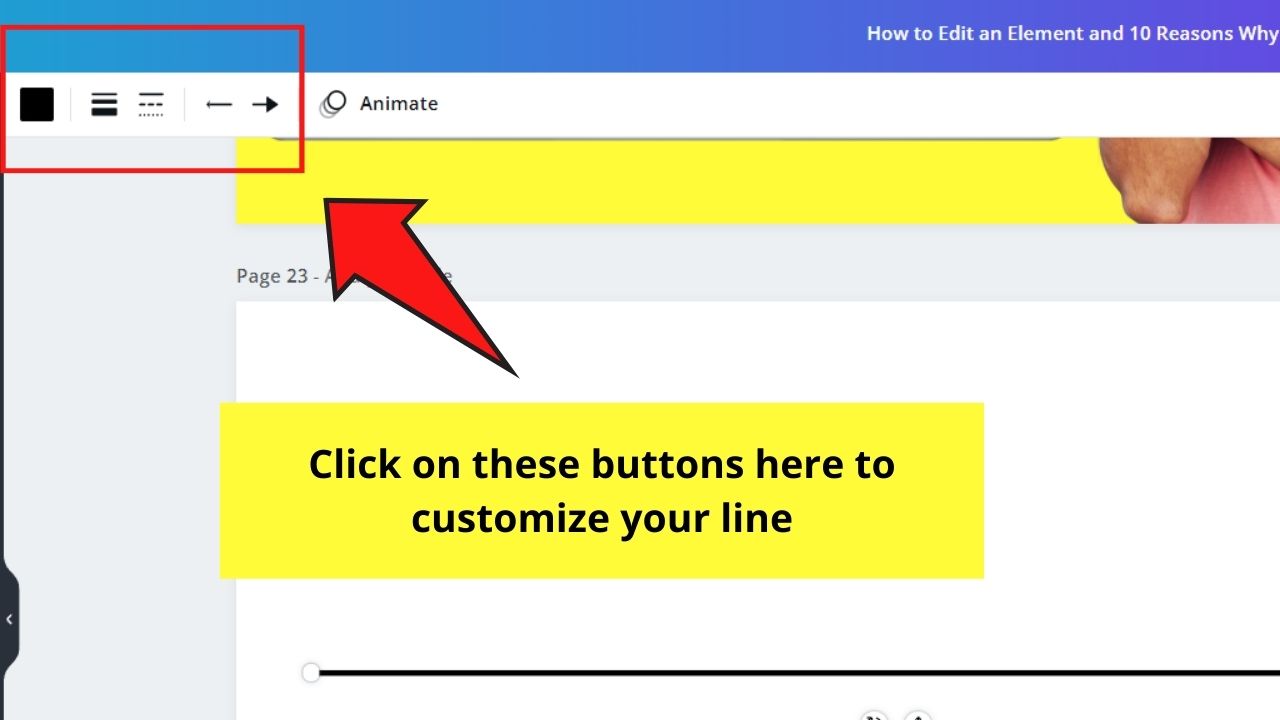
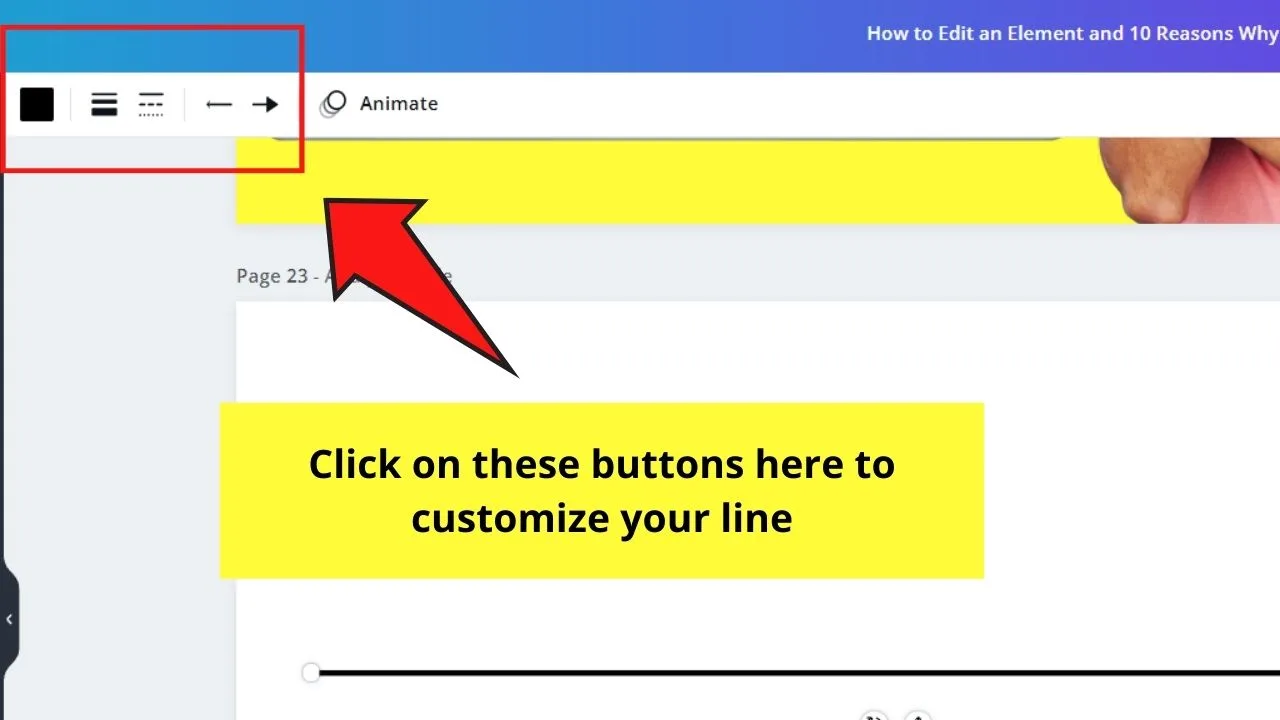
- Color button: Changes the line’s color
- Weight button: Makes the line thicker or thinner
- Style: Changes the look of the current line you have
- End Style: Edits the look of the line’s endpoints
Step 4: Click and drag on an endpoint to resize the line.
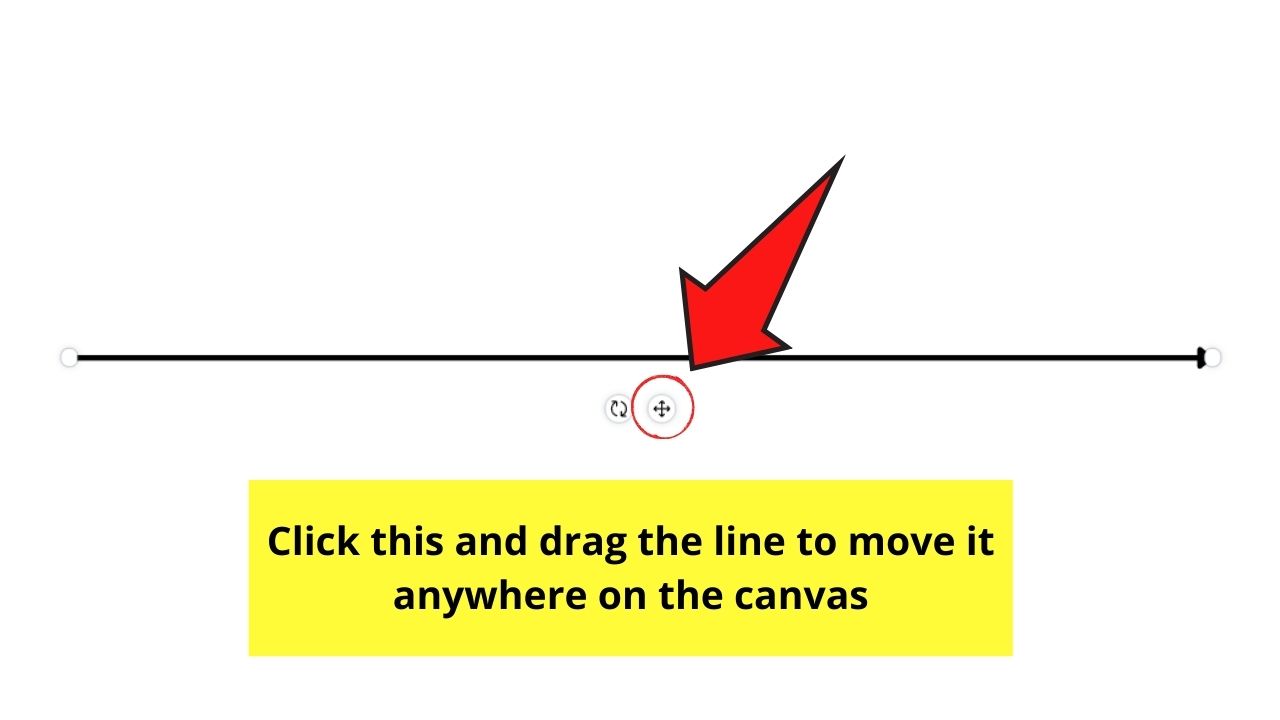
Step 5: Move the entire line by clicking and dragging it to the area where you want to position it.

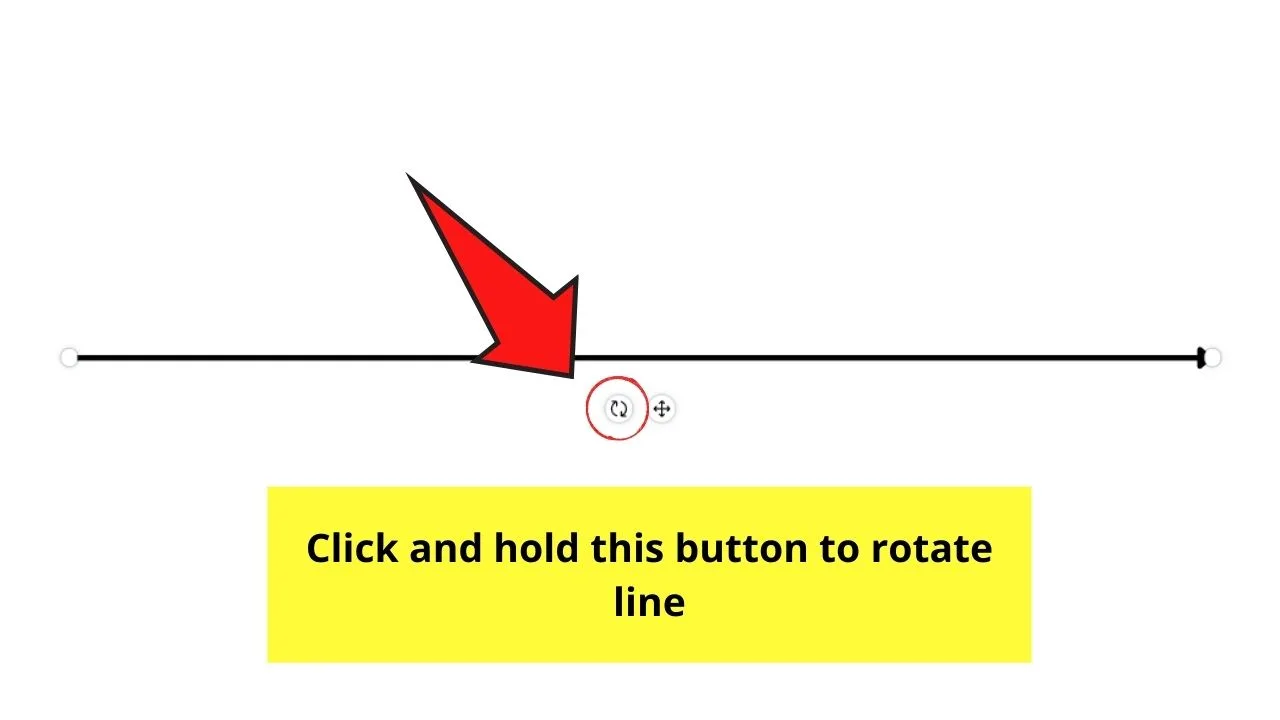
Step 6: Rotate the line by hovering over it until you see the encircling arrows icon. Click on it to rotate the line.

Shapes
Step 1: Select a shape you’d like to use from the gallery. You can also add a specific shape through keyboard shortcuts.
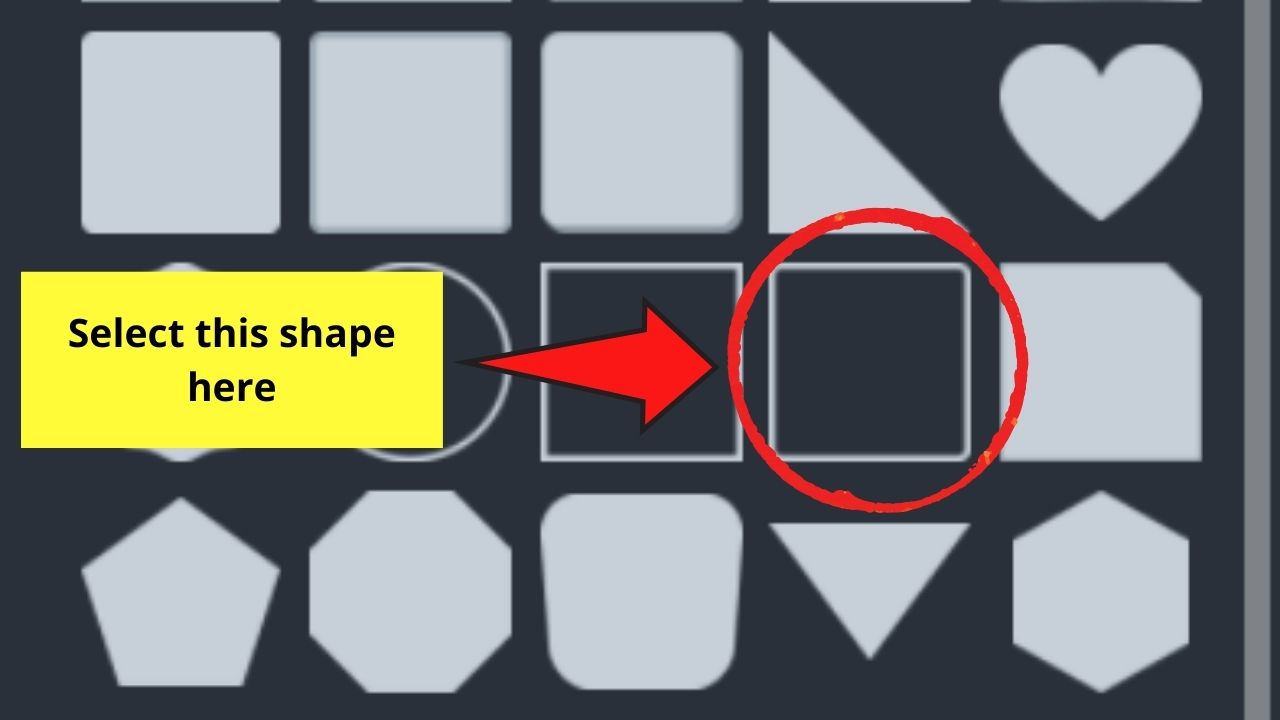
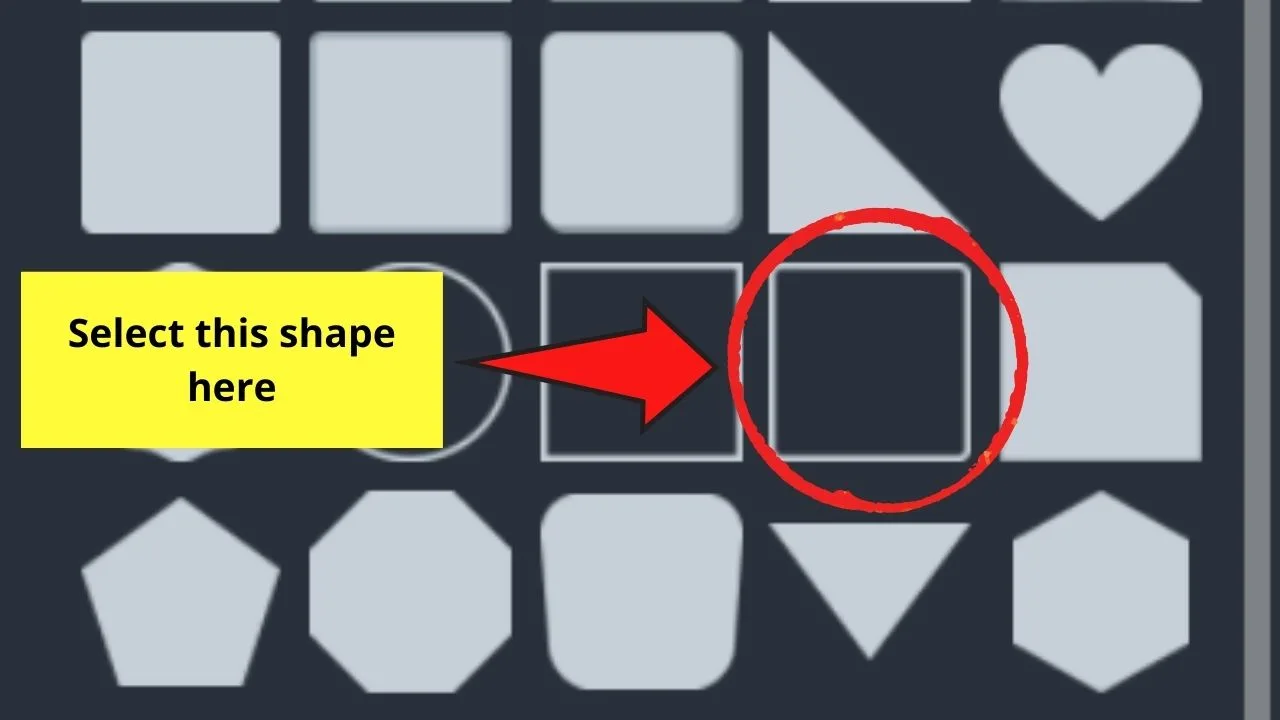
The most common ones I use are “R” for rectangle and “C” for circle.
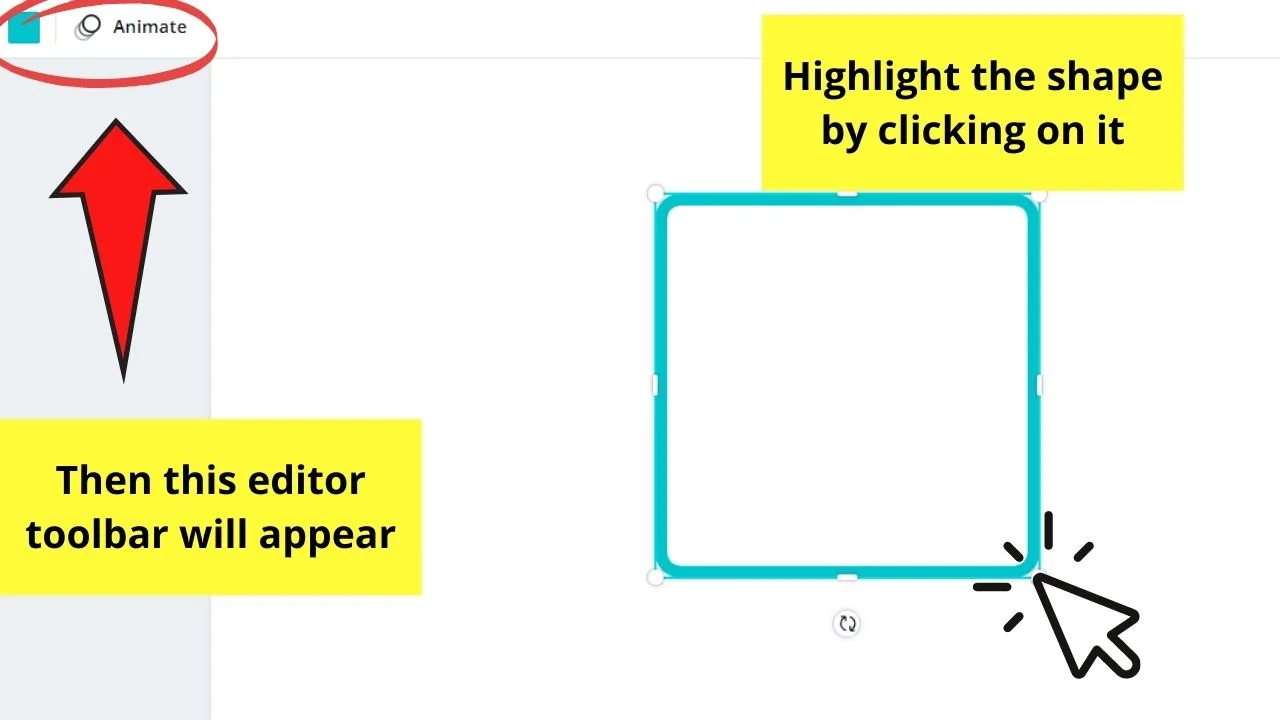
Step 2: Tap on the shape to highlight it. This will activate the editor toolbar above the canvas.

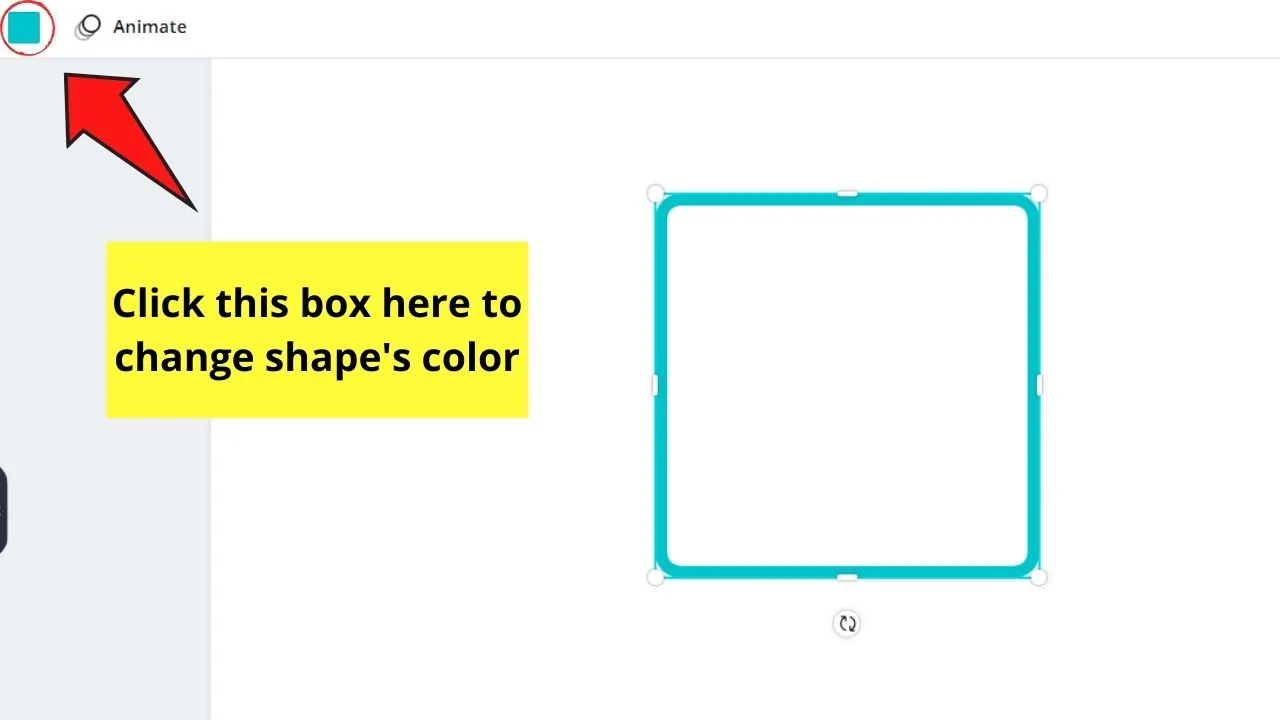
Step 3: Change the shape’s fill color (or its borders if it’s a hollow shape) by tapping on the colored box on the toolbar. This is how you fill a text box with color in Canva (if you’re using a rectangle).

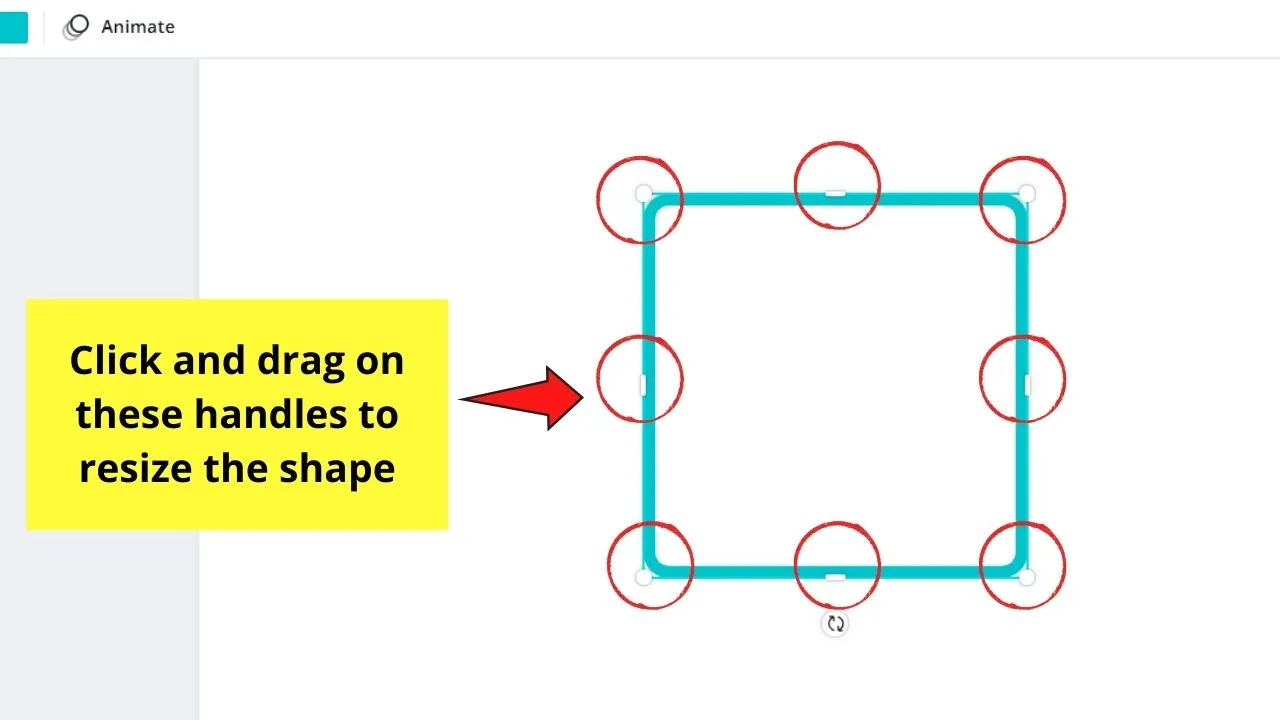
Step 4: Click and drag the shape using the white handles to resize it.

Step 5: Rotate the shape by hovering on it until the encircling arrows icon appears.
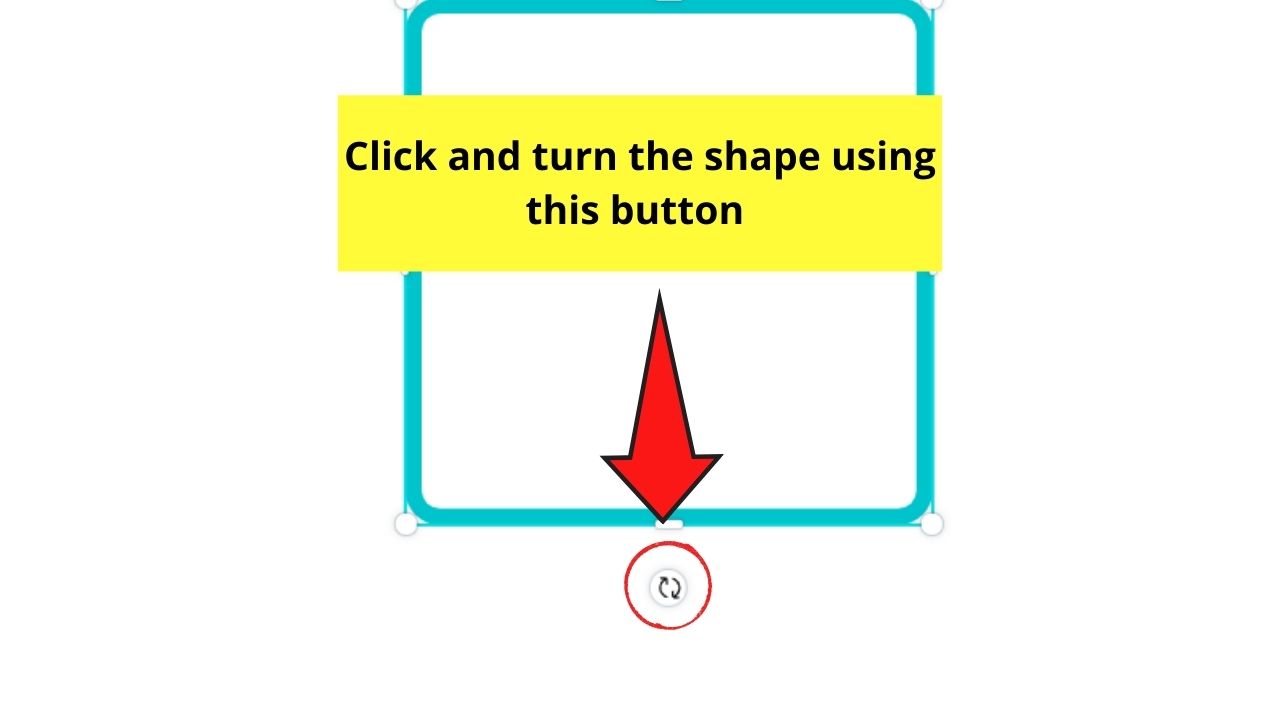
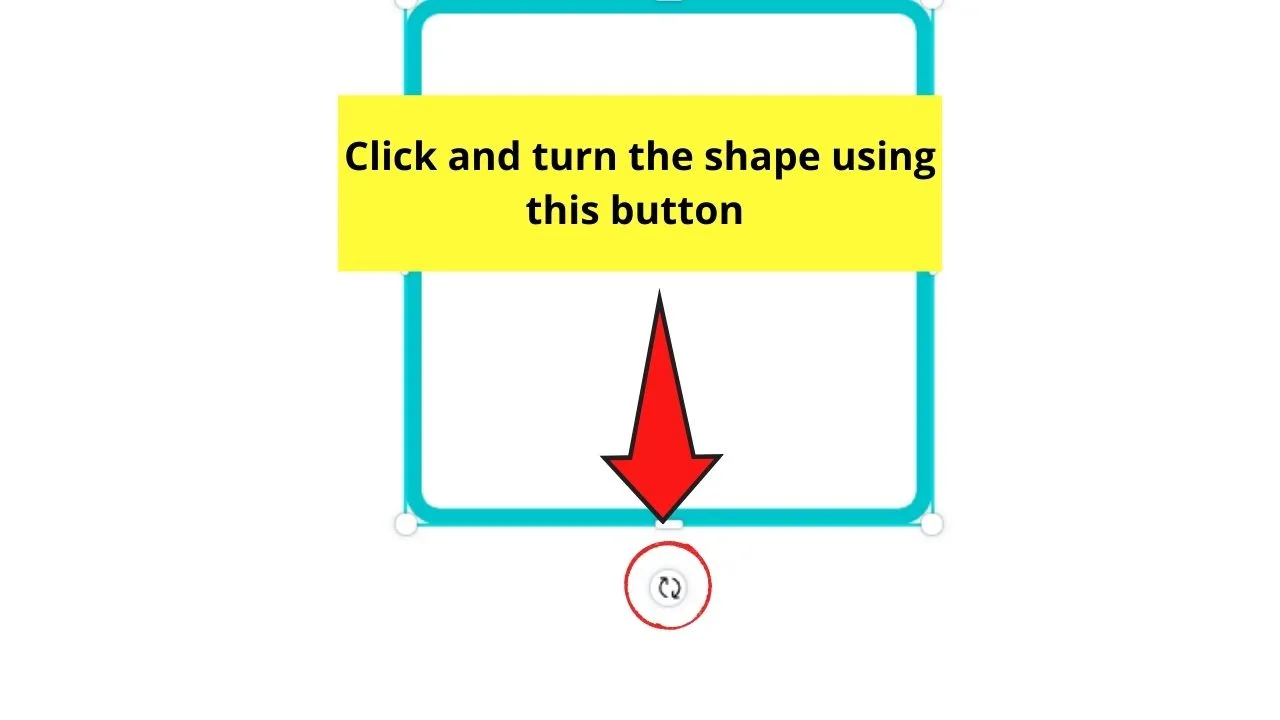
Click and drag the shape to change the shape’s orientation (except in a circle).
Graphics
From the name itself, you’ll associate graphics with images.
But, while you’re nearly correct on that one, graphics serve as the catch-all term for the following:
- Icons
- Stickers
- Illustrations
So, you can find all the graphics you need in this part of the Elements gallery. Plus, to make your search easier, Canva arranged them into categories.
Once you’ve selected the graphics you’d like to use, click and drag it to the canvas to begin your editing.
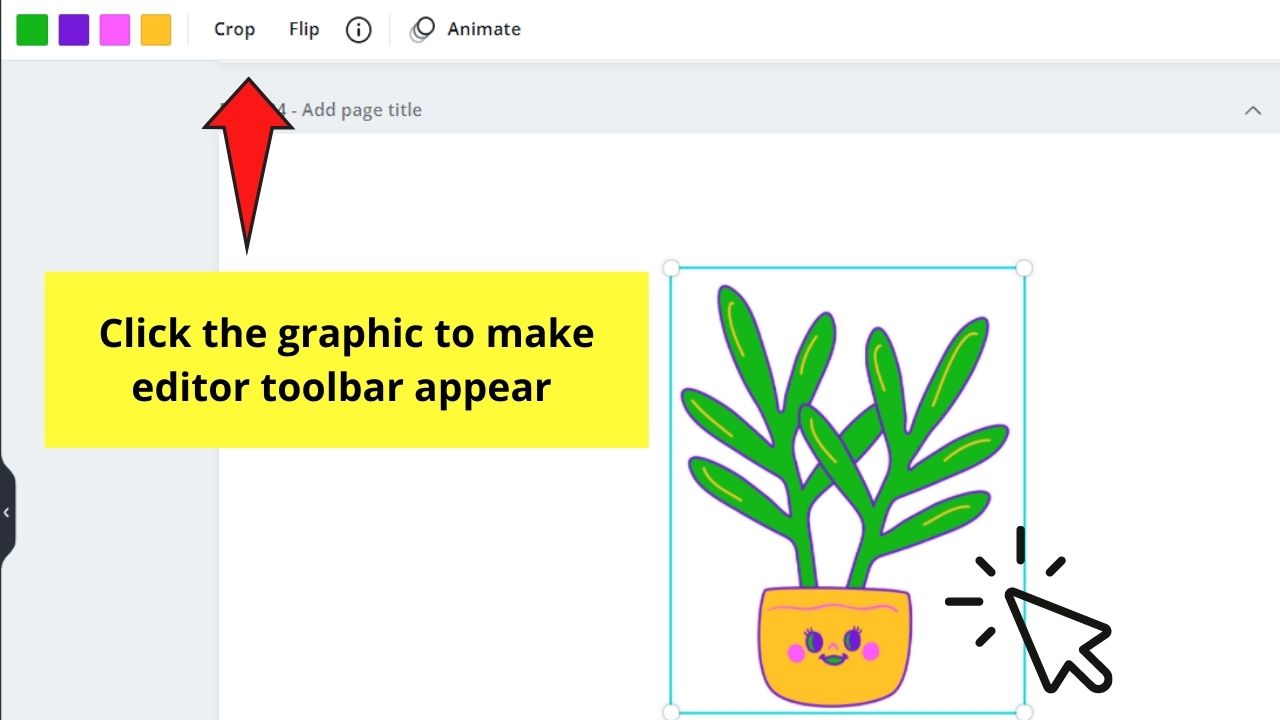
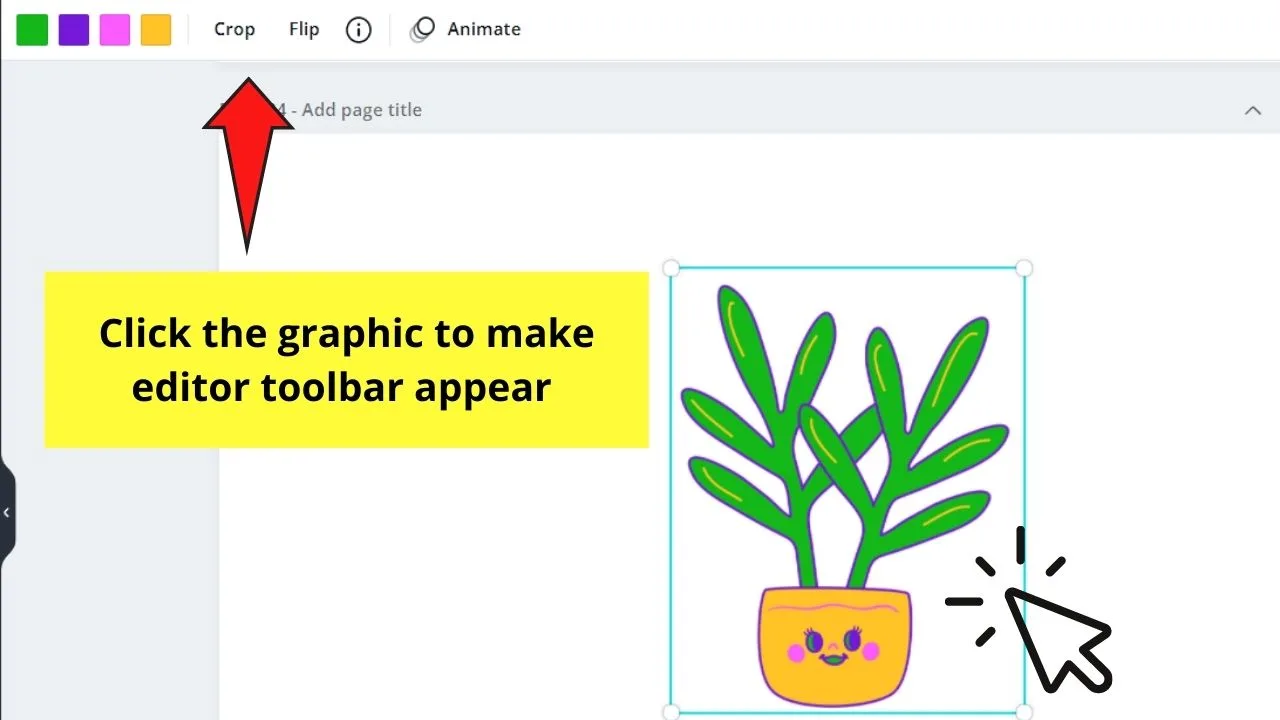
Step 1: Click on the illustration you’ve selected to highlight it. The editor toolbar will then appear.
Step 2: If you see colored box/es on the editor toolbar, it means you can change the graphic’s colors.
Simply click on each of the boxes to customize the colors.
Now, if you’re using stickers, you, unfortunately, cannot edit its colors as it’s already pre-made. But, unlike GIFs, you can crop stickers.
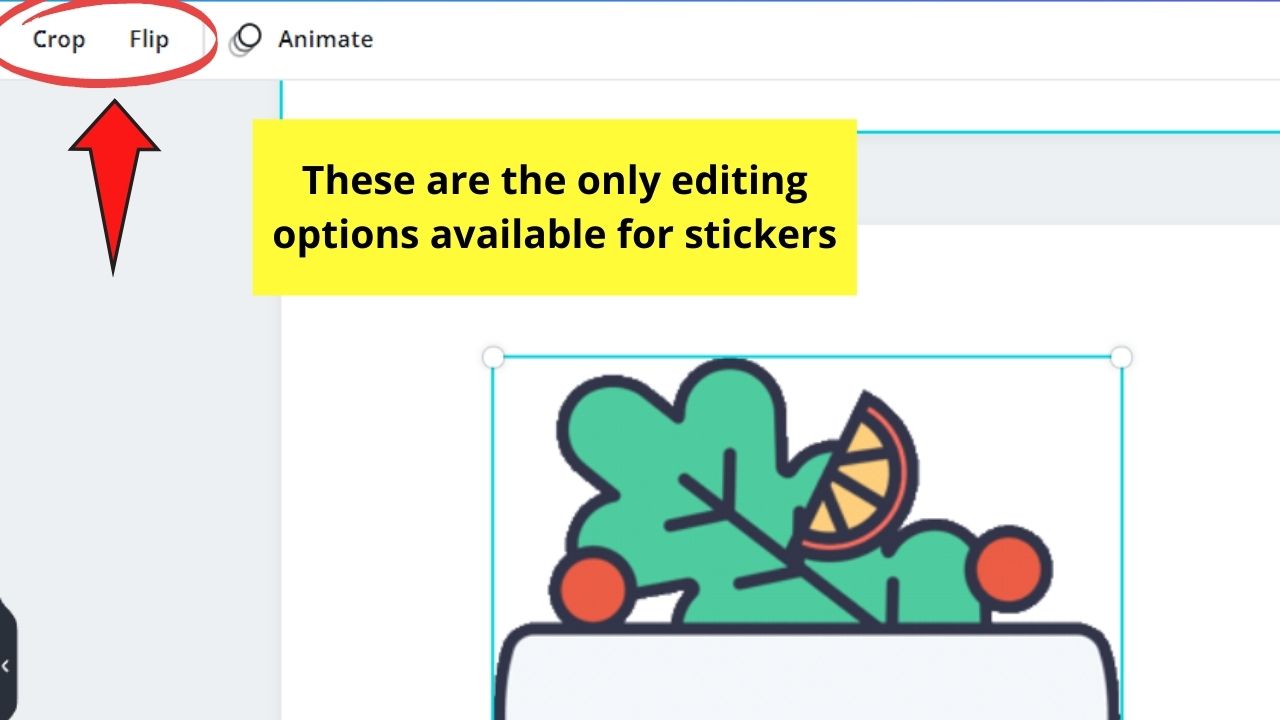

Step 3: Tap on the “Crop” button to cut out some parts of the graphic. This will automatically grey out the surrounding canvas.
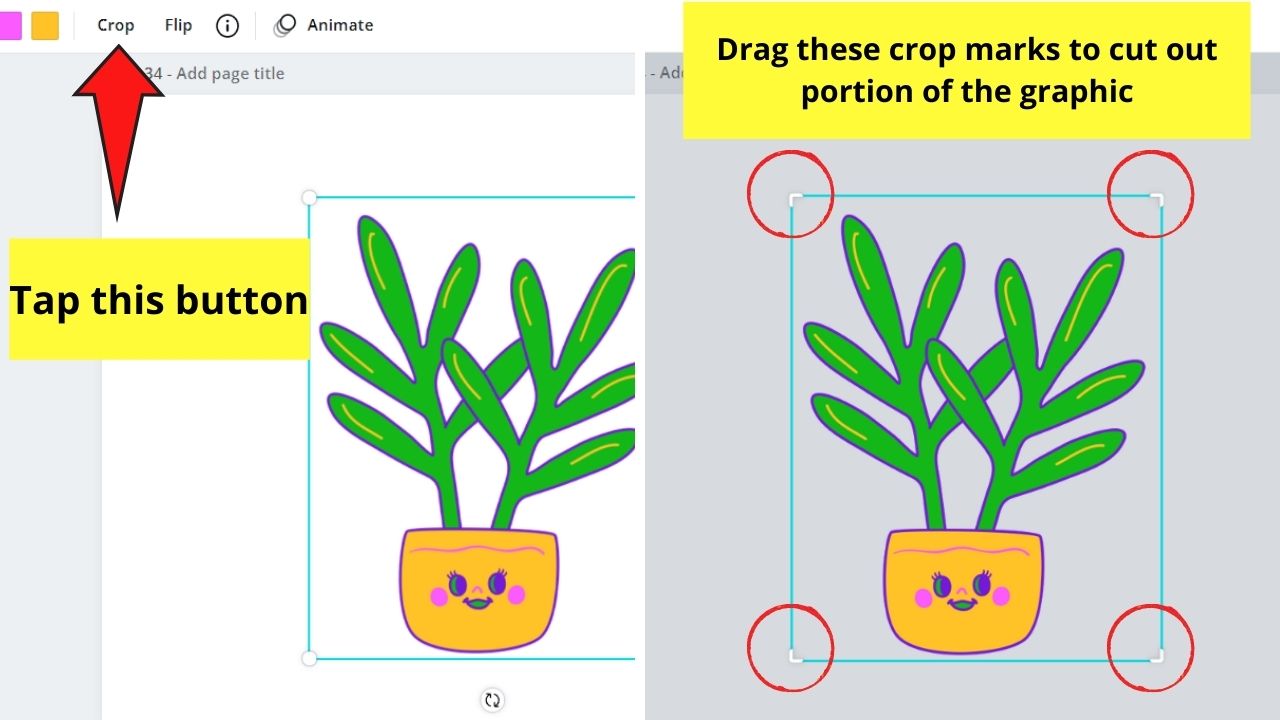

Then, drag on the white crop marks to cut out the parts you don’t want to appear on your design.
Step 4: Tap on the “Flip” button to either make the graphic face to the left or the right — in short, change its orientation.

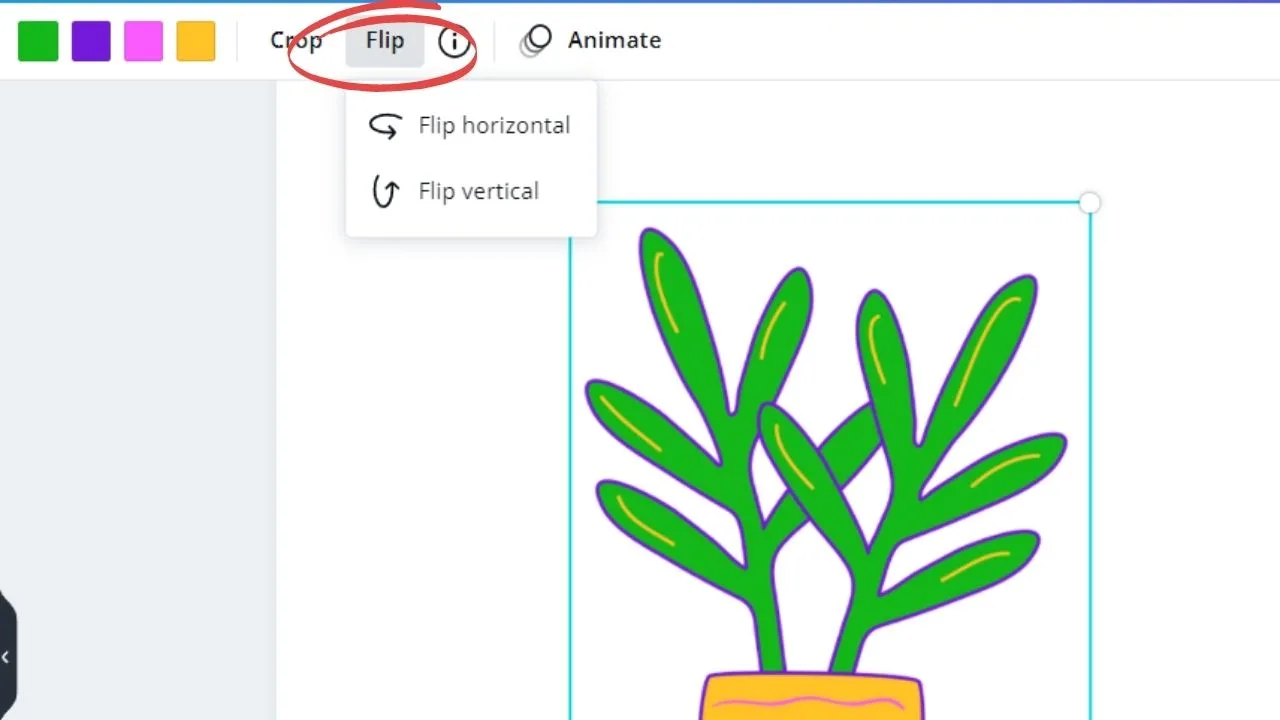
You can learn more about changing a graphic’s orientation by reading how to mirror an image in Canva text on this site.
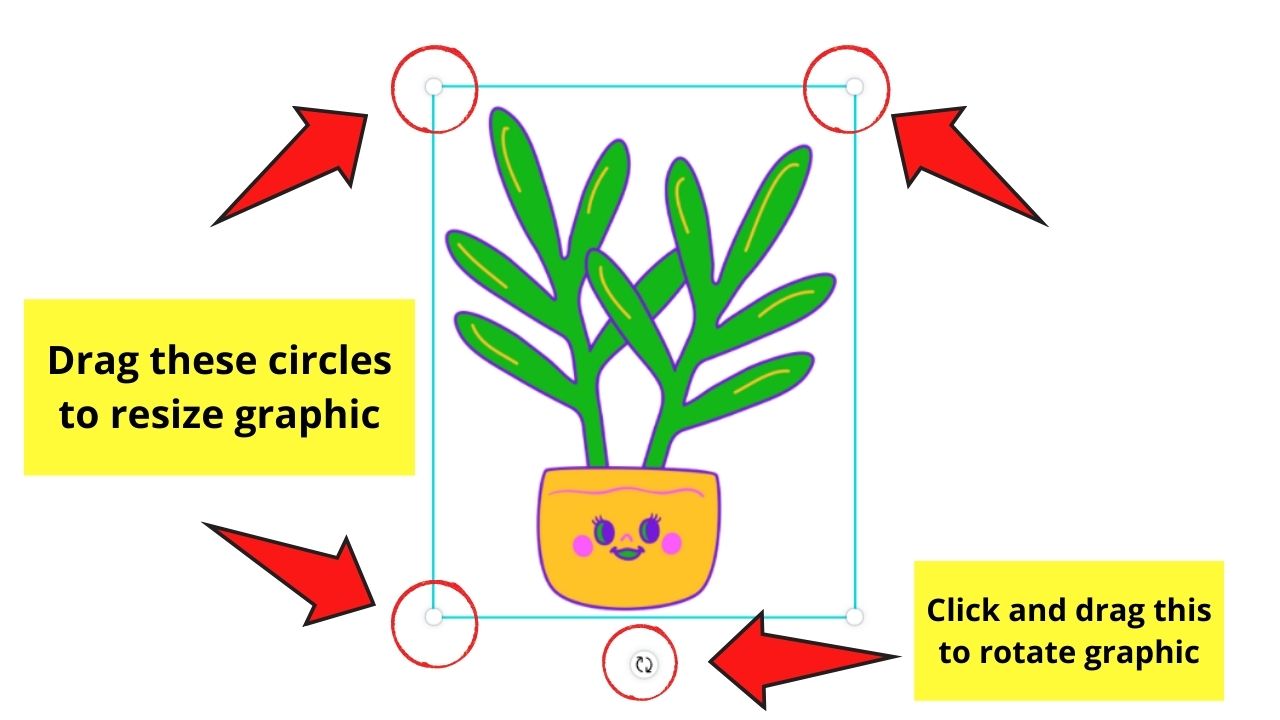
Step 5: Reposition the graphic on the canvas by clicking and dragging it.
Step 6: Resize the graphic by dragging on the white handles to make it bigger or smaller. You can also turn it with the rotate icon below the said graphic.

Charts
Charts visually represent data that are eye-catching and easily understandable at a glance.

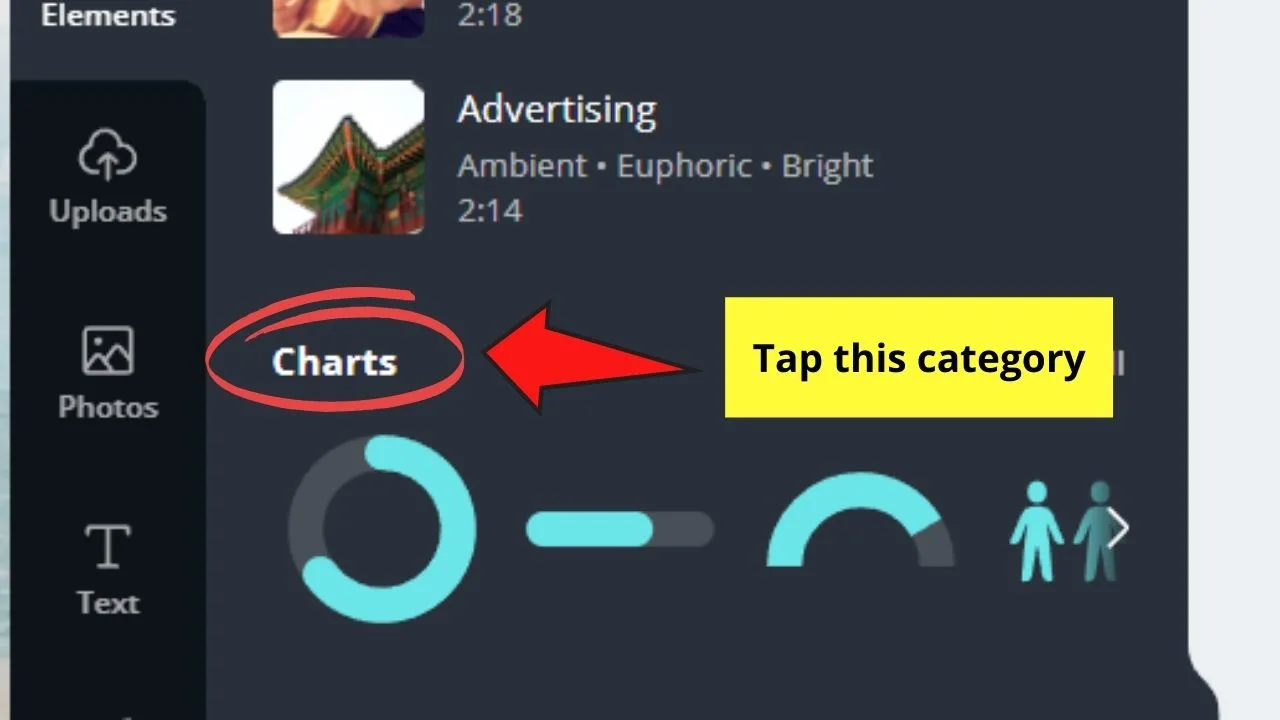
You can find this section under the Elements tab, or you can create a separate section by tapping on the More tab on the left-side menu.
Technically, there are 2 types of charts you can find in Canva:
Graphs
The more advanced of the two, graphs serve to still visually represent data, but through an X and Y-axis.
Examples of graphs include the famous bar graphs and pie charts.
To edit graphs, follow these steps:
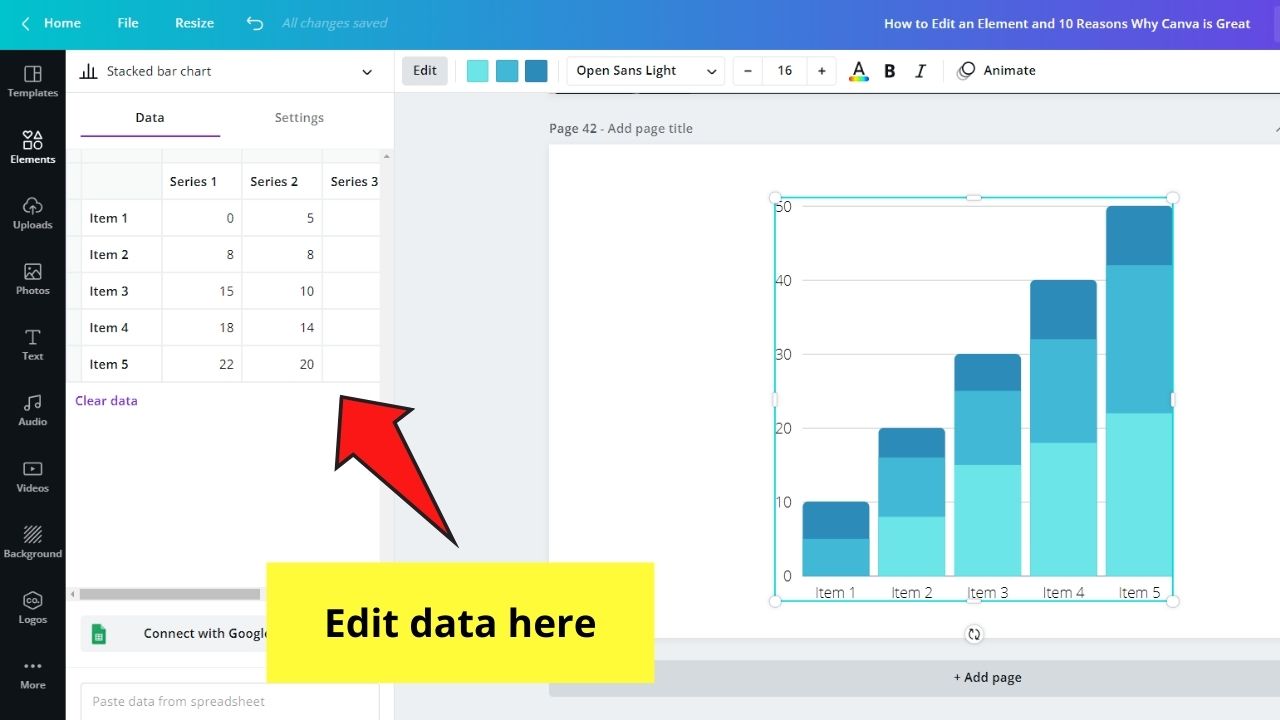
Step 1: Select a bar or pie chart style from the gallery by clicking on it.
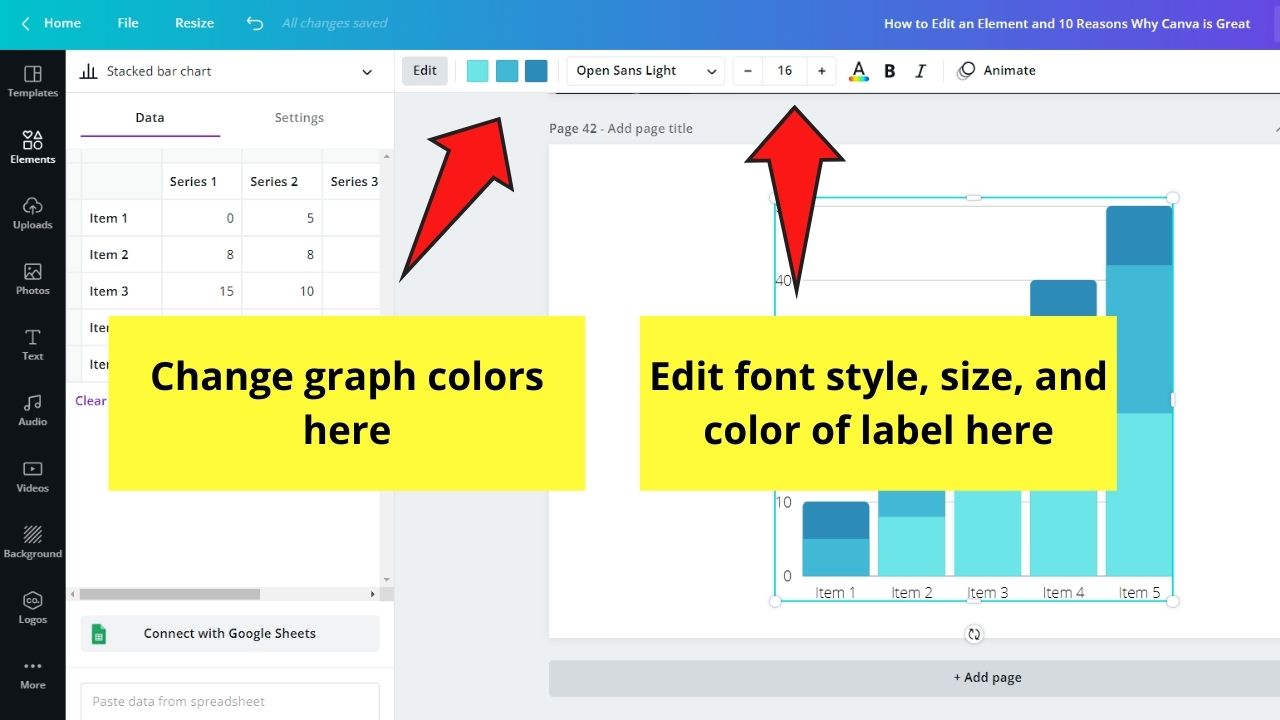
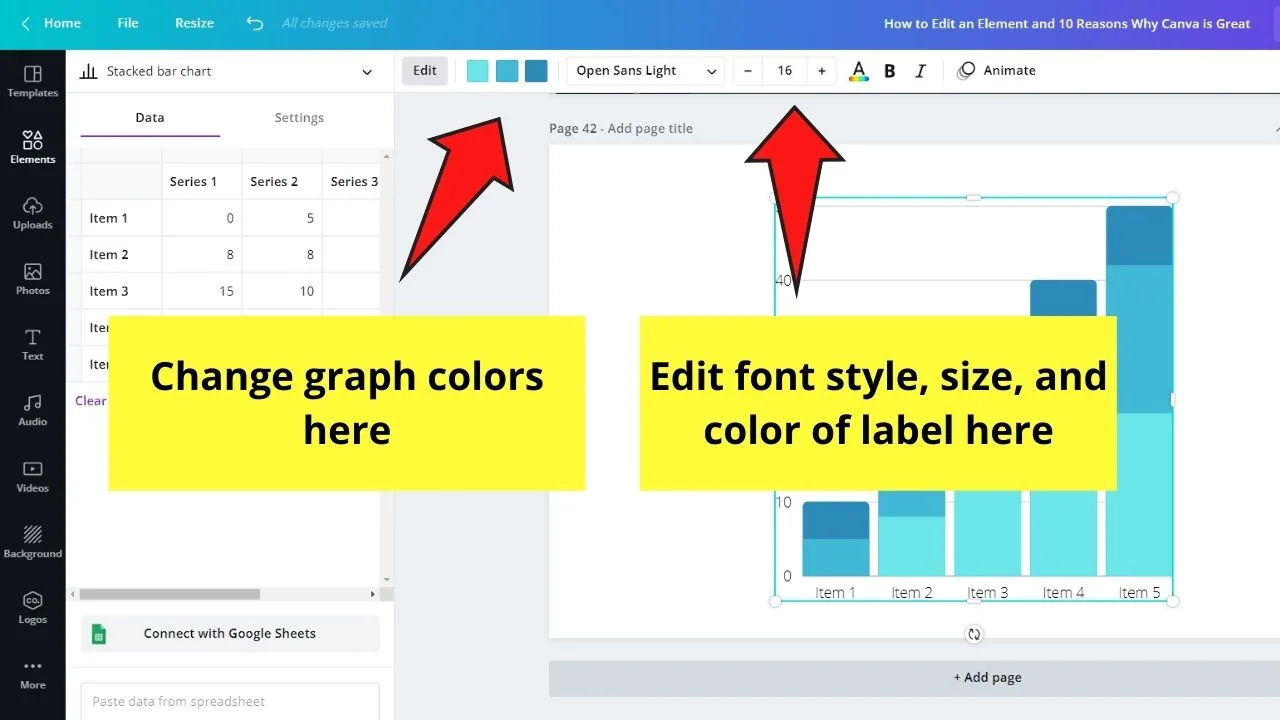
Step 2: Once the graph’s on your design, the sidebar panel will then show you the data/detail fields. You can edit these by encoding the numbers and labels accordingly.

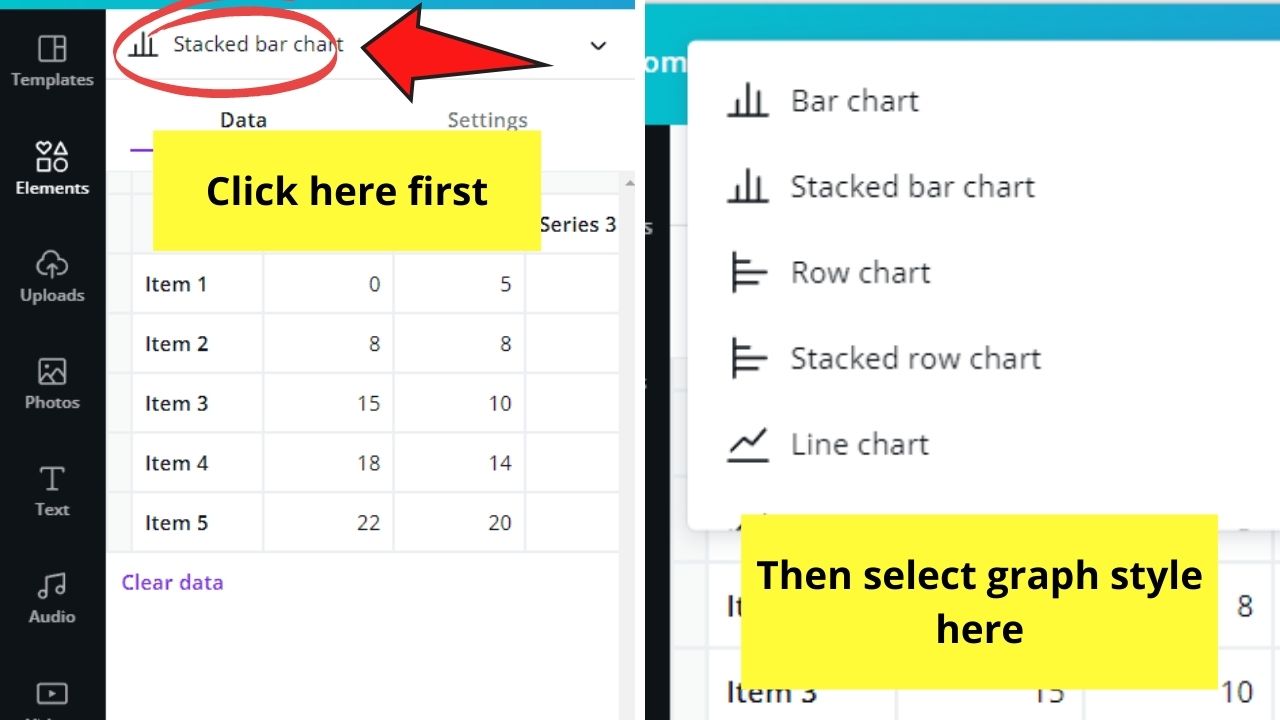
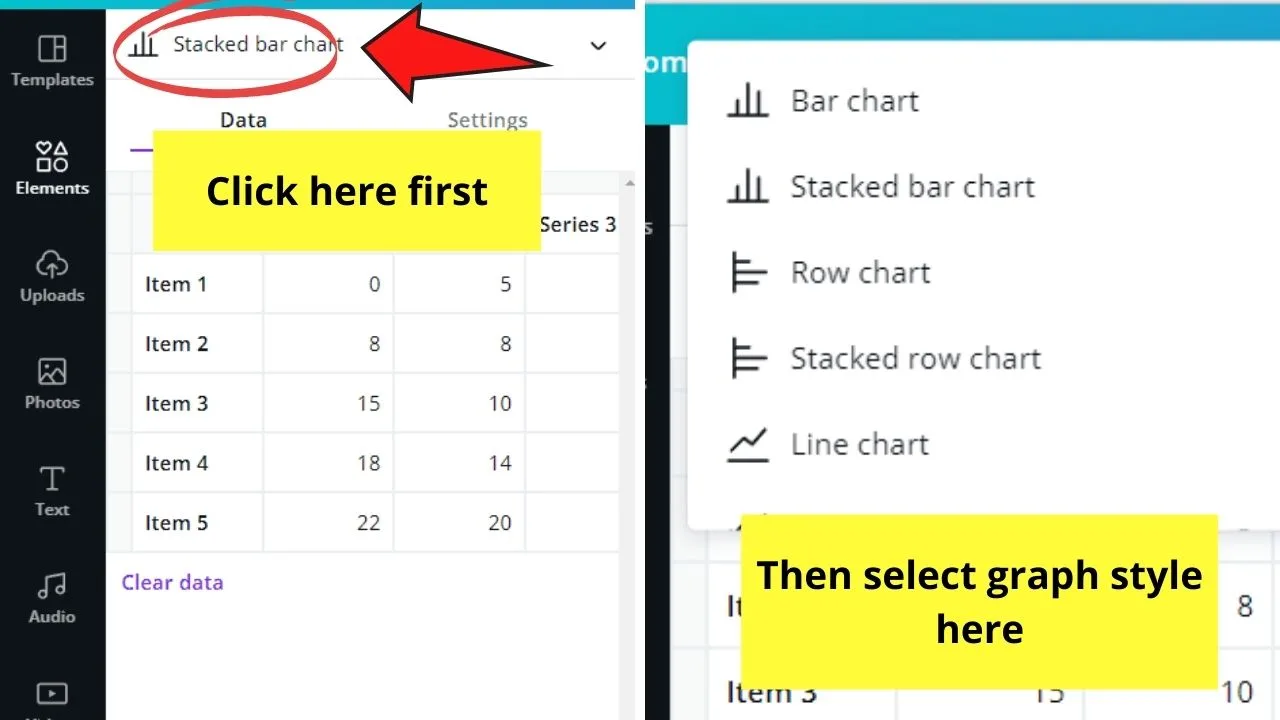
Step 3: If you prefer another type of graph, tap on the graph name and select one from the dropdown menu that appears.
Step 4: Customize the look of your graph by editing its colors, style, as well as font style, color, and size of the labels.
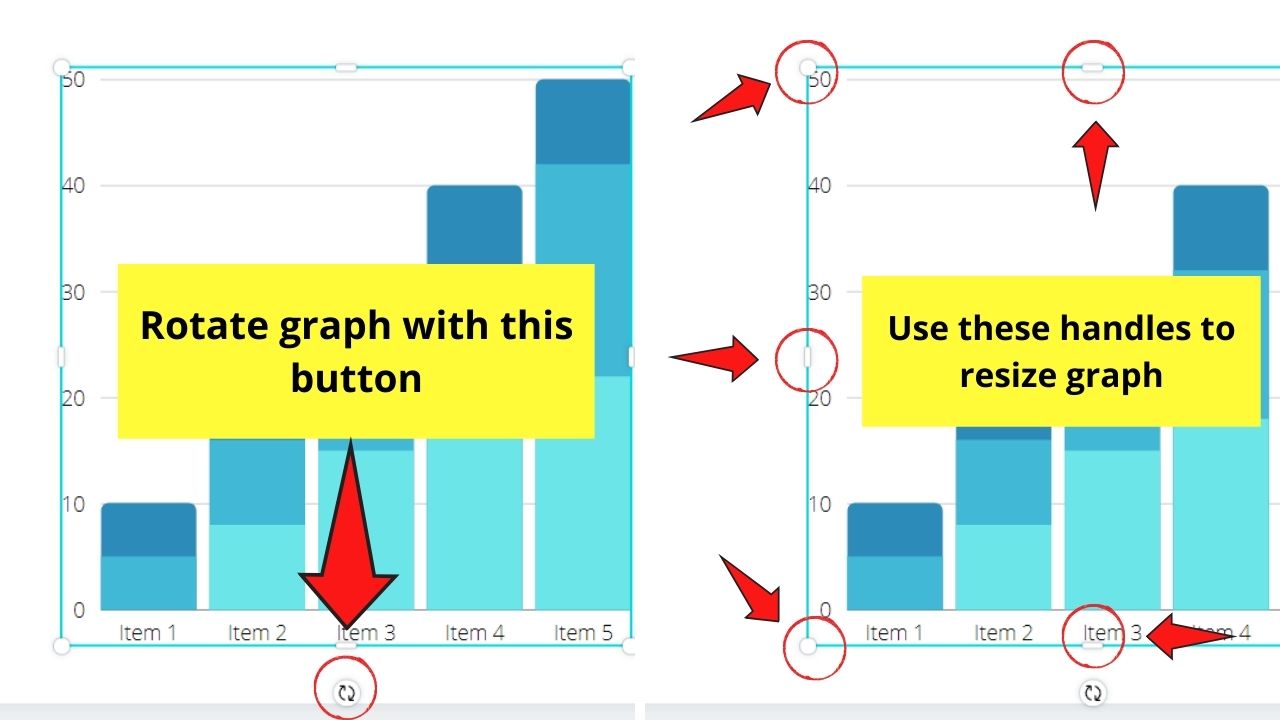
You can even rotate and resize it like most of the elements in Canva.

However, you can’t build your graph from scratch yet as Canva didn’t add such a feature as of the moment.
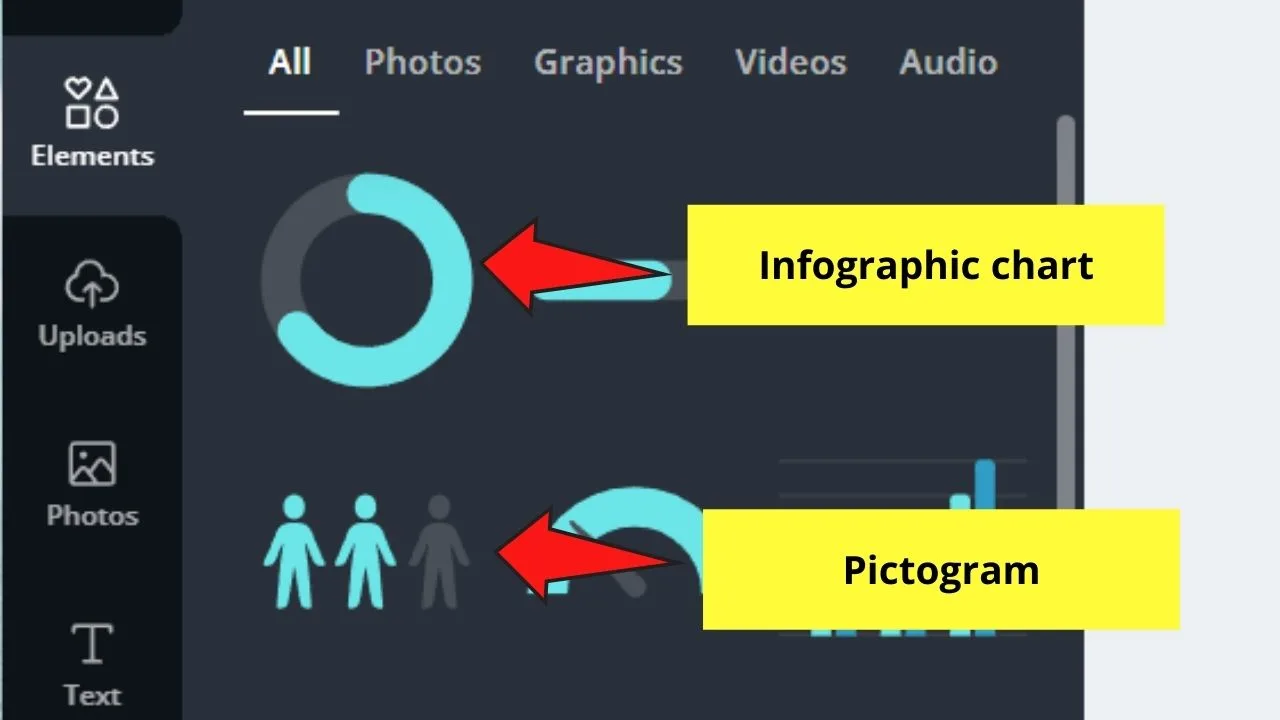
Infographic Charts
Infographic charts are best for showing quick stats like percentages and progress reports. And, from the name itself, you can use this element for creating infographics on Canva.


Now, let’s get started with editing your infographic chart:
Step 1: Select a chart from the gallery. Click and drag it on the blank canvas.

Step 2: Once the chart’s on the canvas already, a sidebar will then appear. You’ll then see the categories where you can edit the data, as well as its looks.
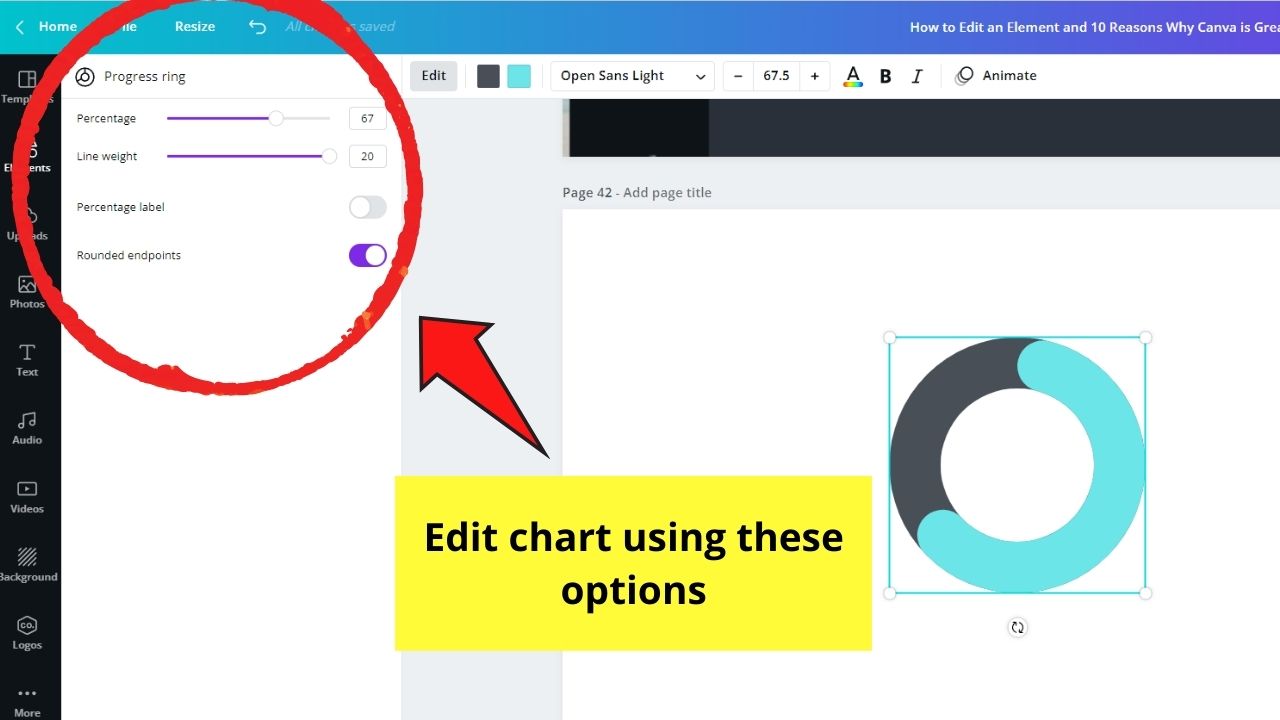

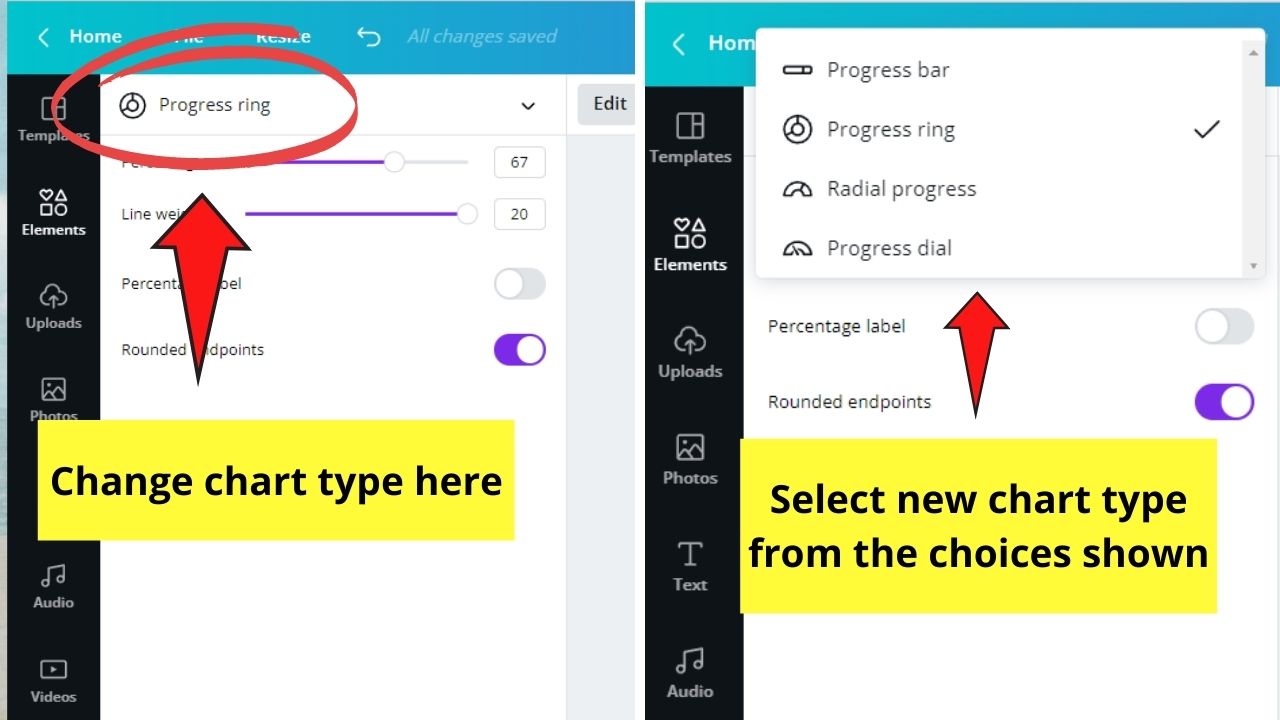
Step 3: If you don’t like the chart you’ve selected, change the style by tapping on the chart name and select another chart to use.

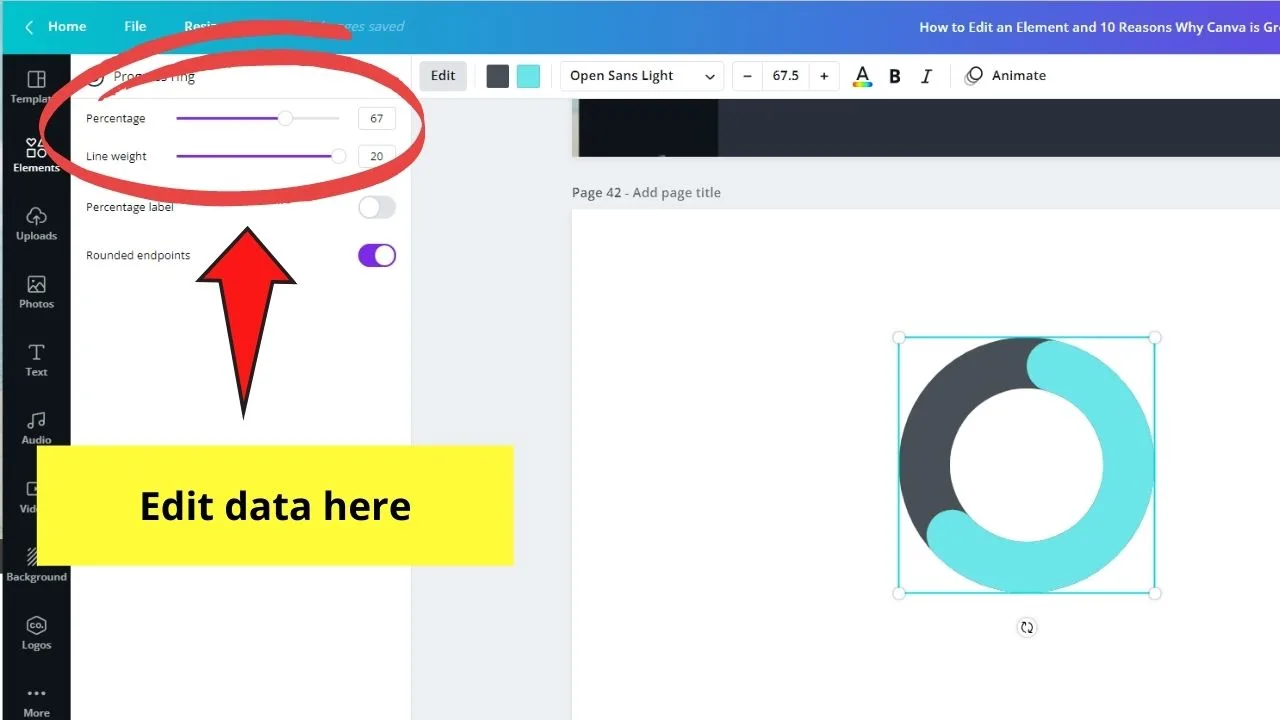
Step 4: Edit the data you’ll present on the graphic by dragging on the corresponding slider bars. Some of the slider bars you’ll see are percentage and line weight.

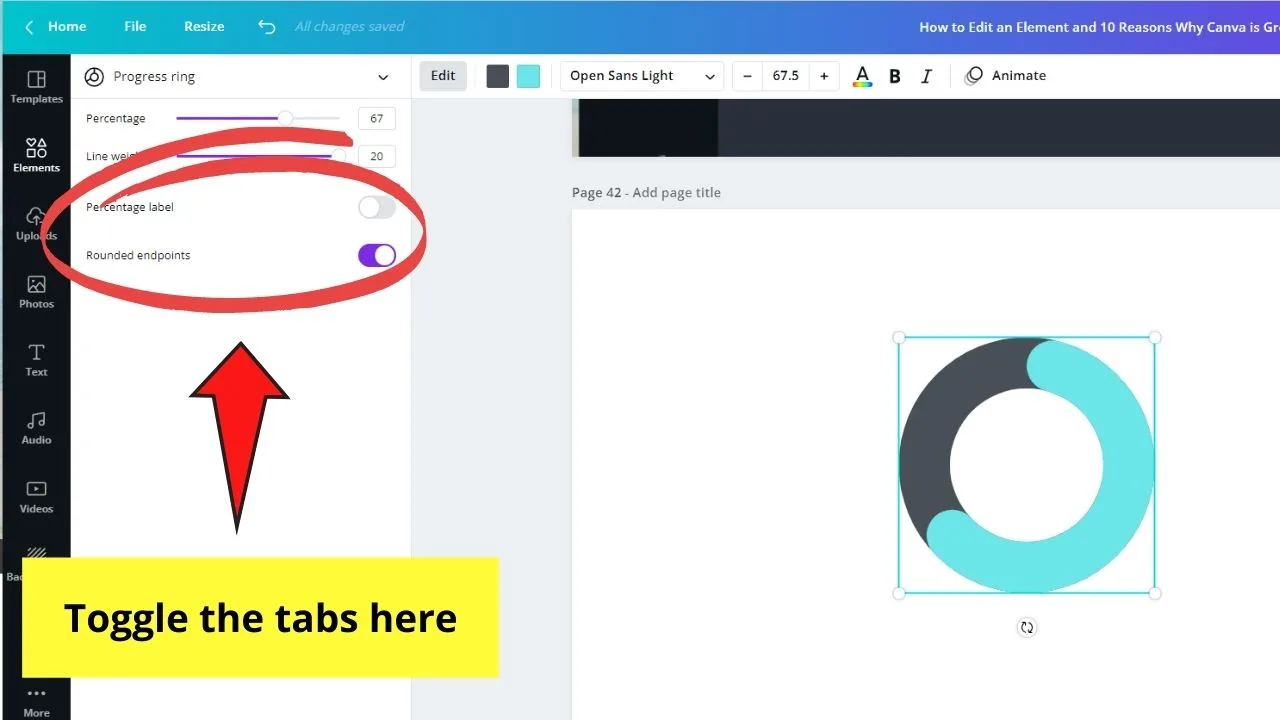
You can also use the toggle tabs to change the percentage labels and if you want to have more rounded endpoints.

Step 5: Edit the chart’s colors, as well as the font style, font size, and font color on the editor toolbar.
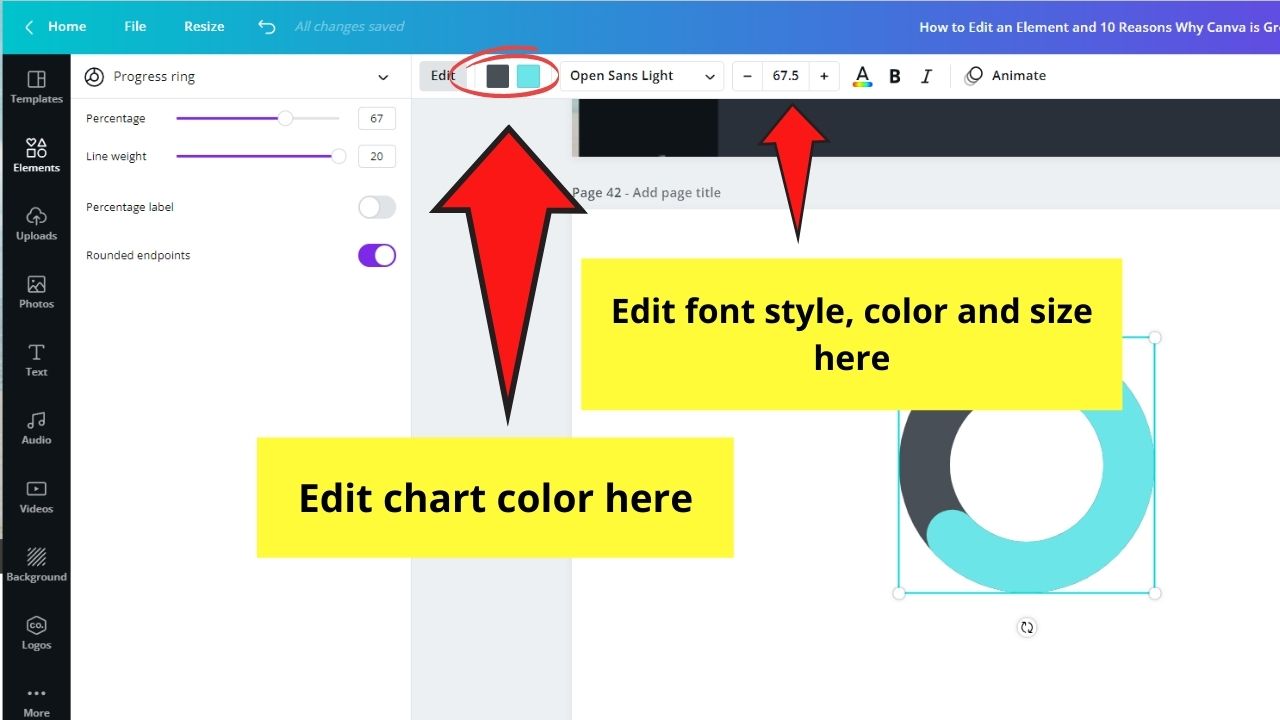

Better learn how to change the text color in Canva to further enhance your graphic designing skill with chart labeling.
Now, if you prefer using a more visual manner of representing your stats, then the pictogram infographic’s your best choice.
With pictograms, you can select the type to use from the sidebar panel, then resize, move, or rotate it according to the picture you have in your mind.
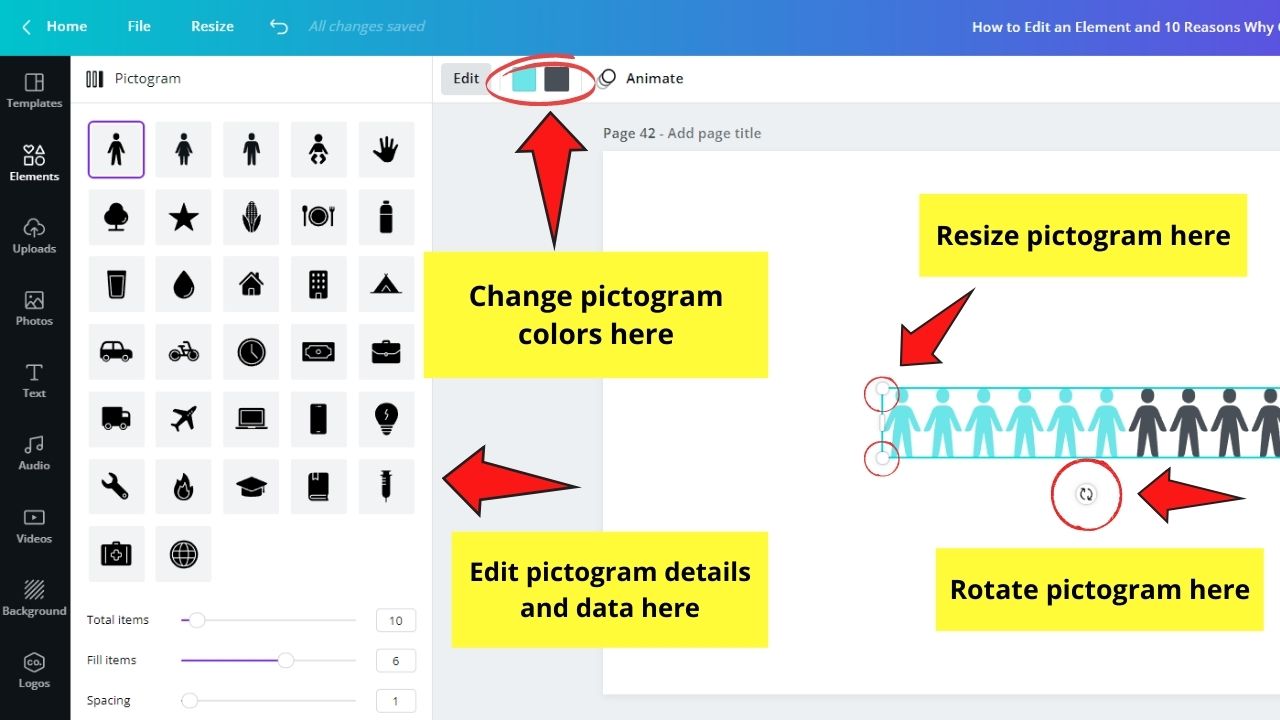
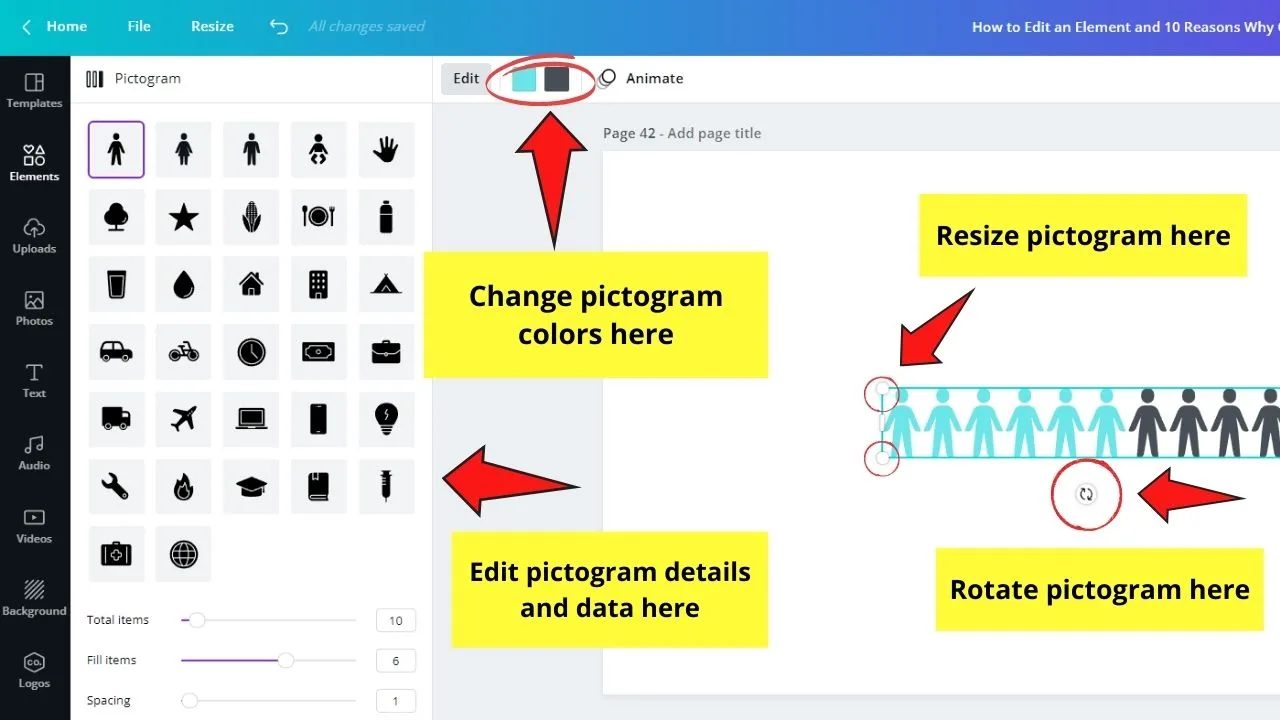
To edit the data you’d like to represent, simply drag on the “Total items” and “Fill items” slider bars.
But, if you want to use other shapes other than the choices presented by Canva, I’m afraid you can’t add your own as of the moment.
Frames
Maybe after hearing this term, you’ll think about picture frames where you put your treasured photos into.
Though Canva frames somehow work that way, they’re more than that. Technically, frames are where you drop your photos into to serve as placeholders.
And, by placeholders, it means you can cut out or crop photos into shapes to add a bit of a fun element to it.
So, to start using frames…
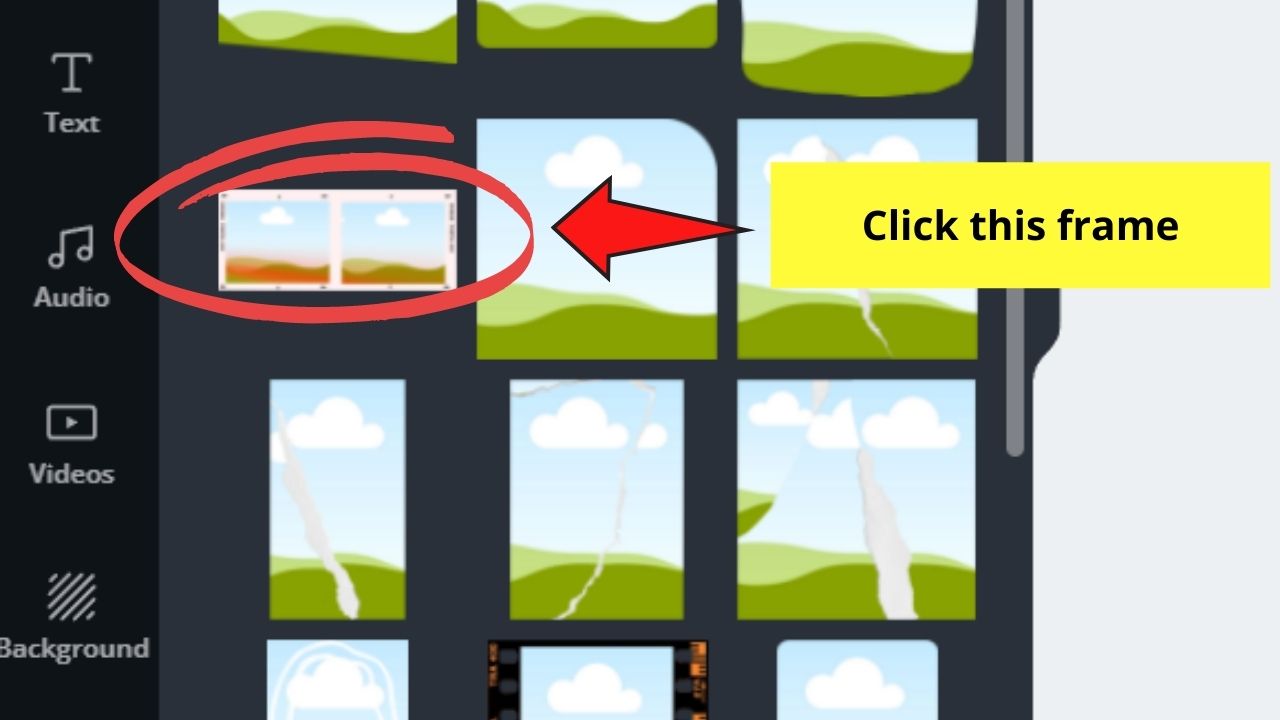
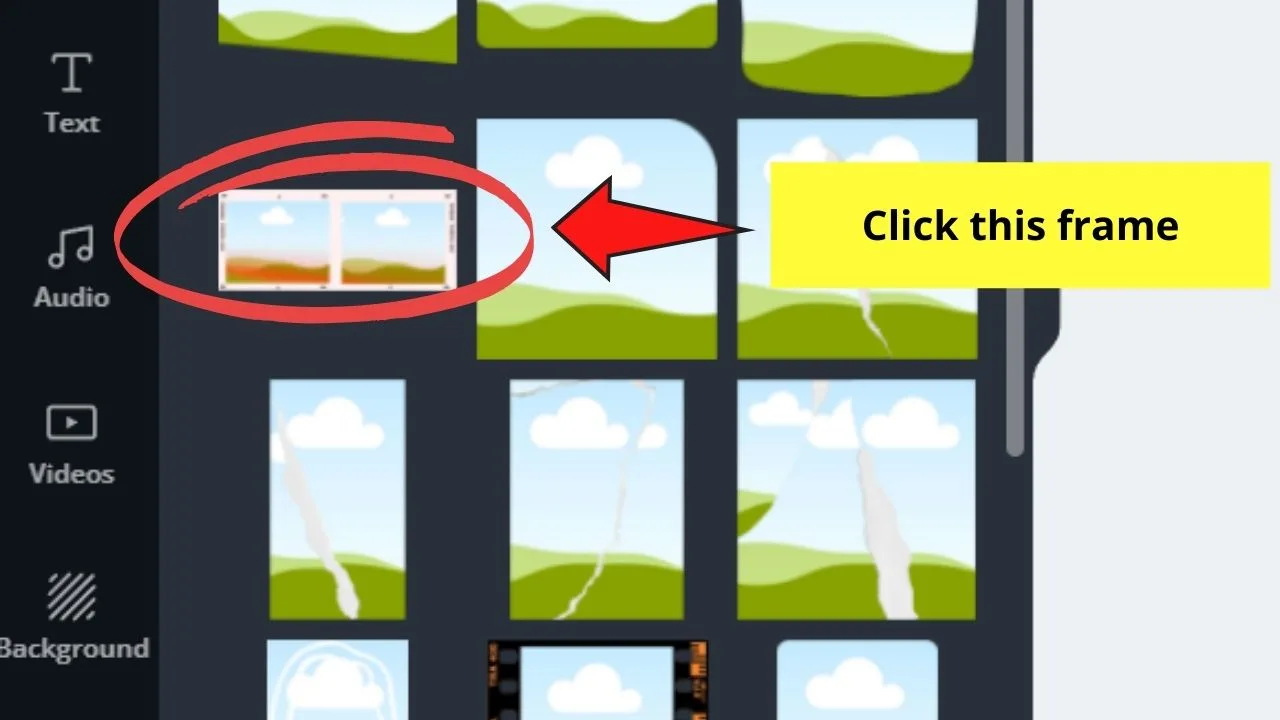
Step 1: Click on the “Frames” section to check out the various frame styles in the gallery.

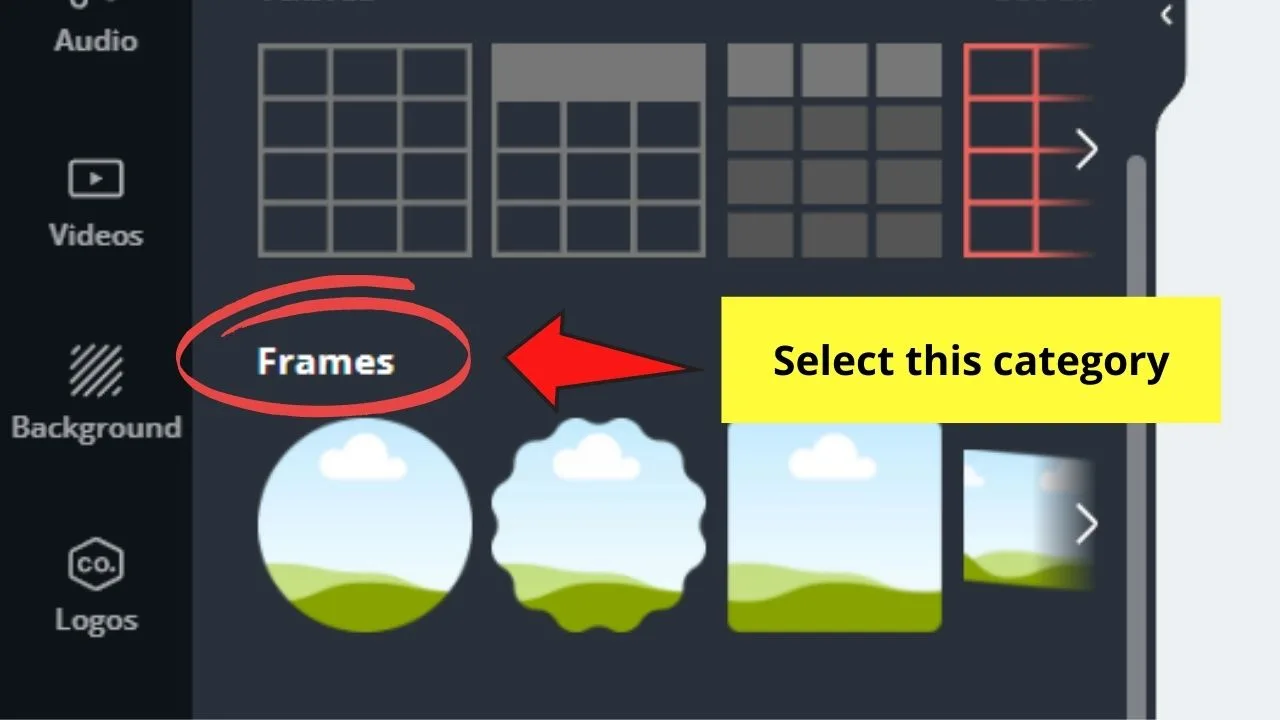
Step 2: Drag and drop the frame style of your choice and adjust its size accordingly.
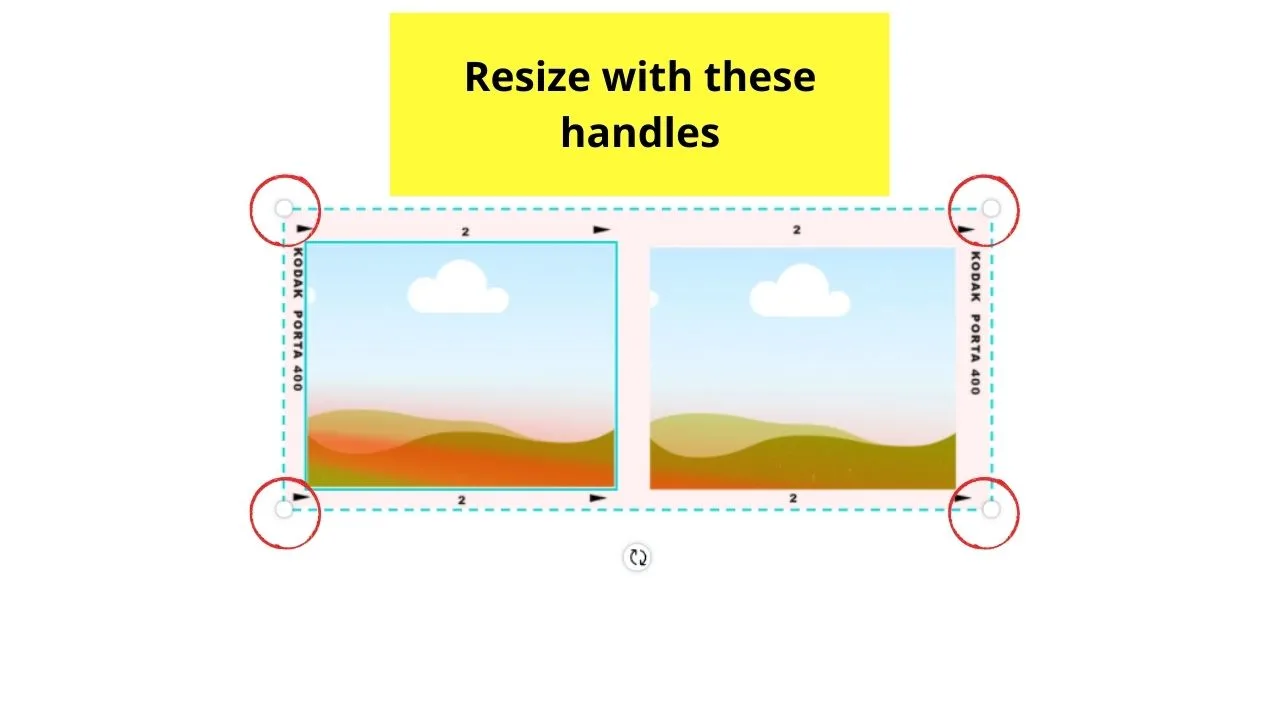
Similar to the other elements, you can make it look larger or smaller through the white handles on the frame’s sides.

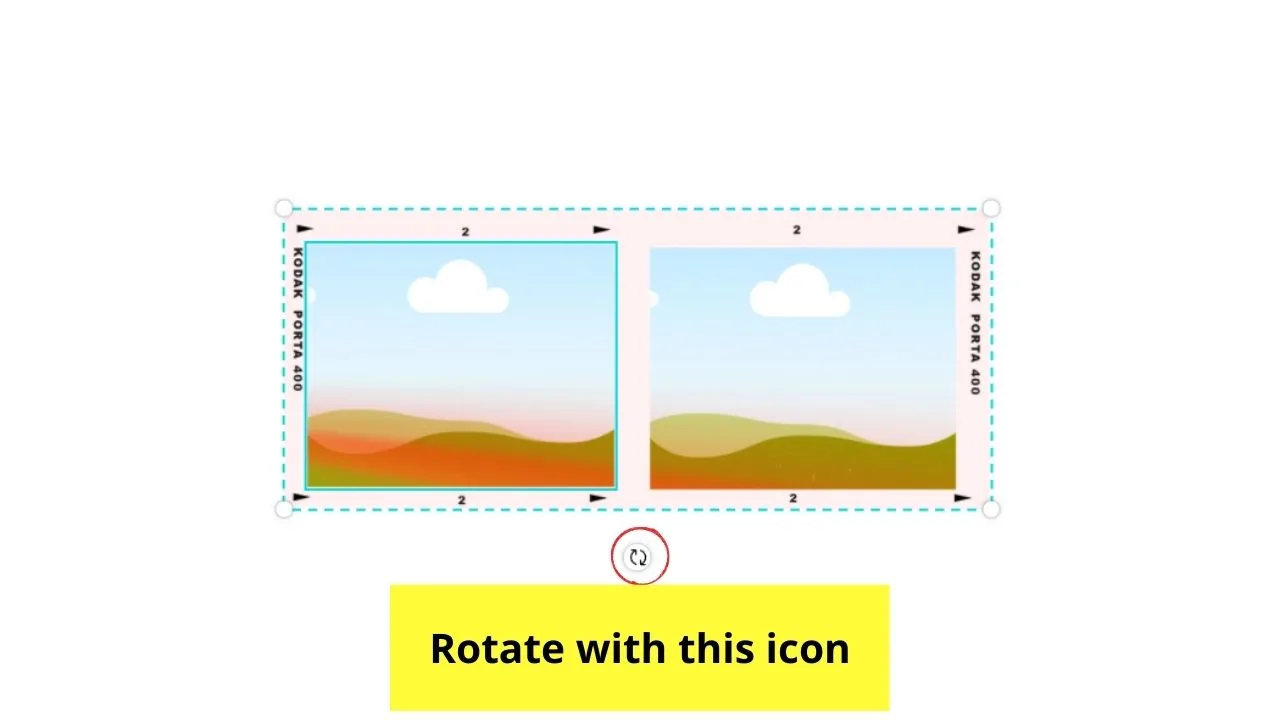
You can also rotate it using the two encircling arrows icon found at the bottom of the frame.

Step 3: If you want to fill your frame with color, simply tap on it to make the rainbow-colored color picker box appear on the editor toolbar.

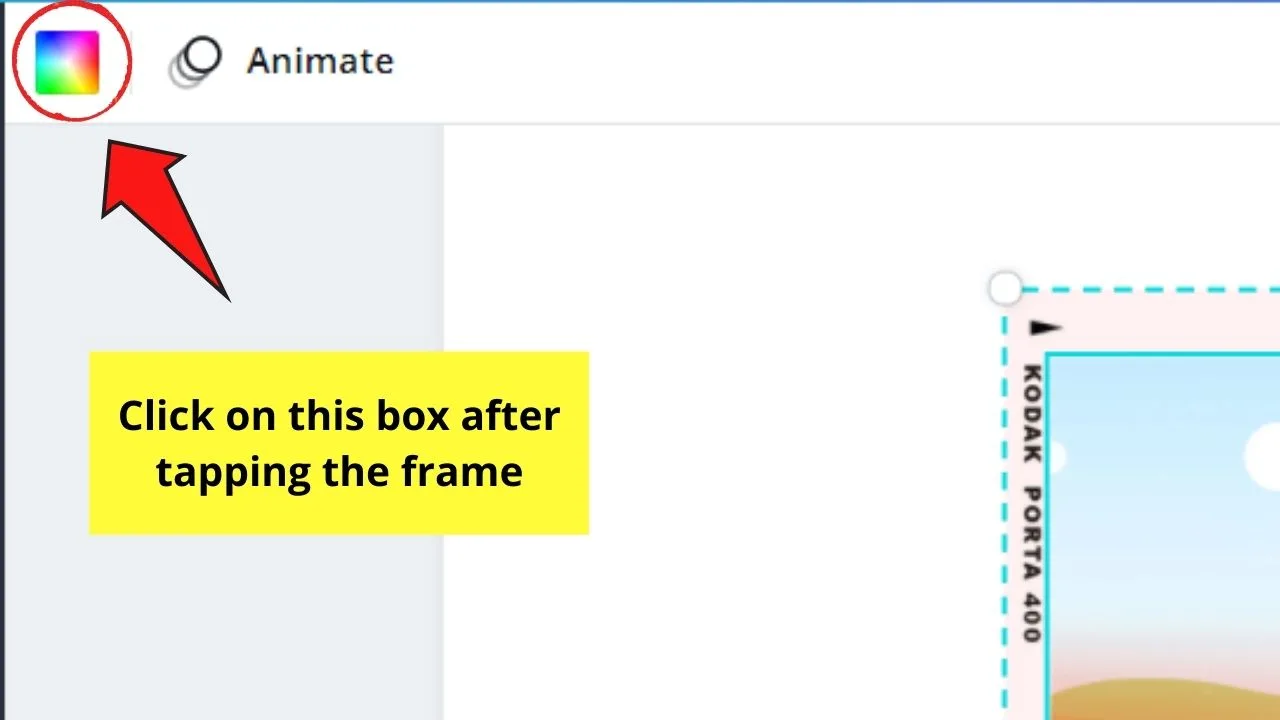
Select the color to use from the various hues in the gallery.
Step 4: If you want to add photos instead of colors, you can head over to the Photos gallery and drag the image you’ve selected into the frame.
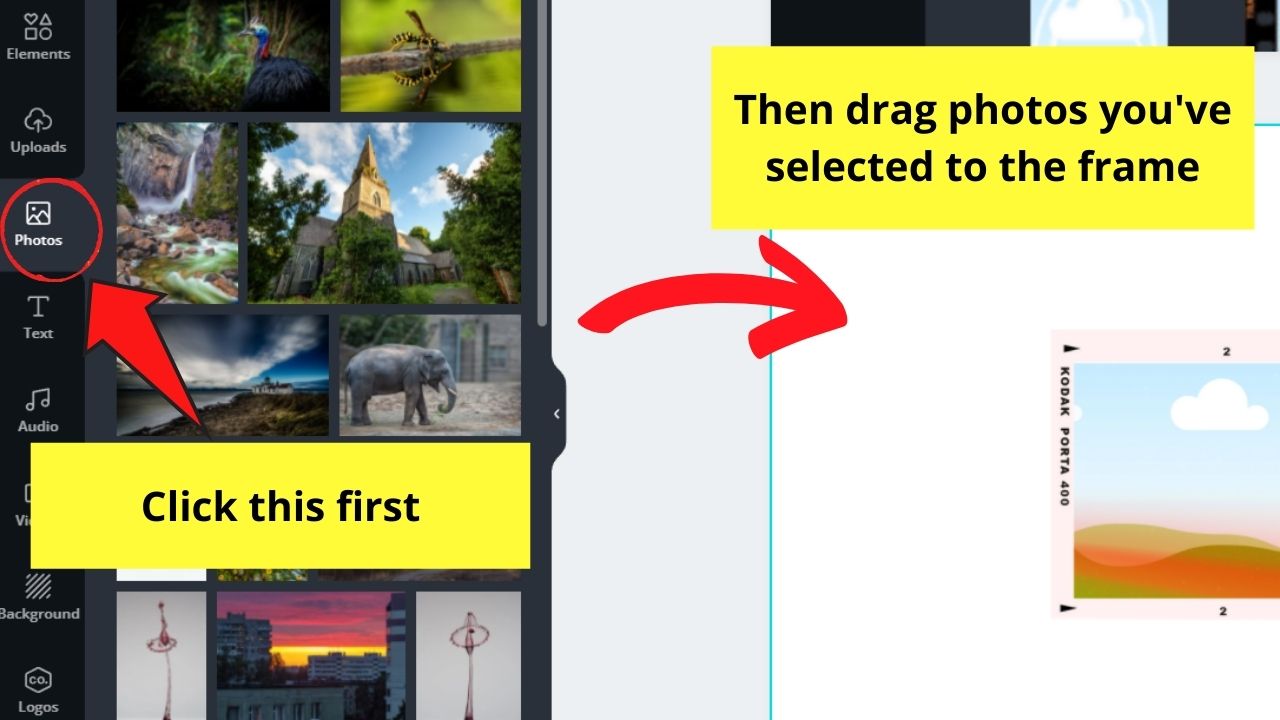

The photo will then automatically fill in the space. But, wait, there’s more.
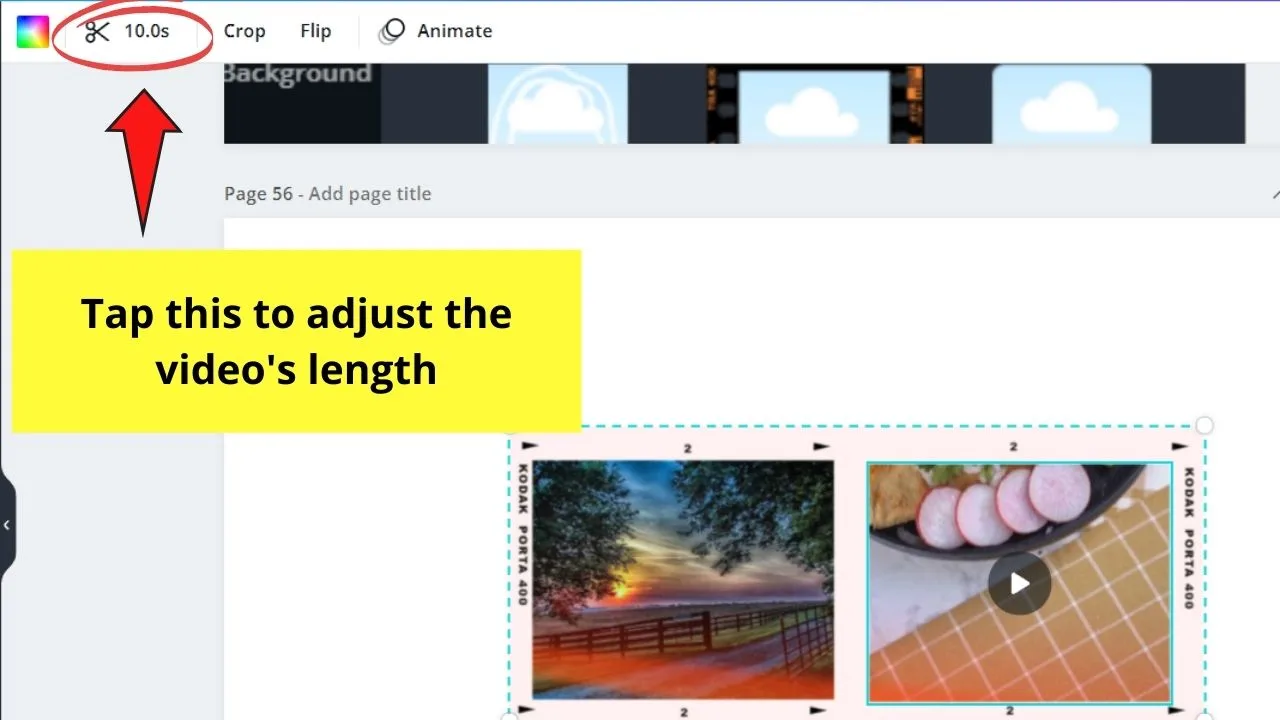
It’s also possible to add video clips onto frames as well. Just follow the same steps as to how you add photos to frames.
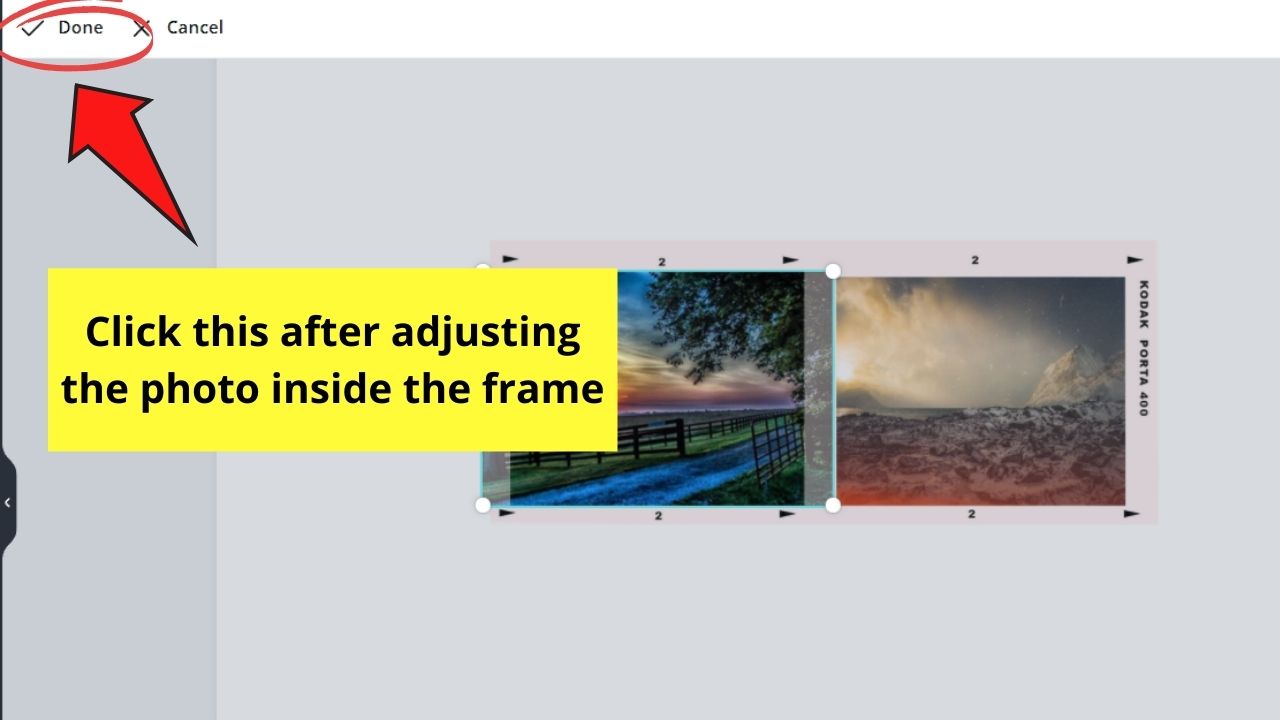
Step 5: Adjust the photo’s crop positioning by double-clicking on the said image. You’ll then see a grid box serving as your guide to the positioning.
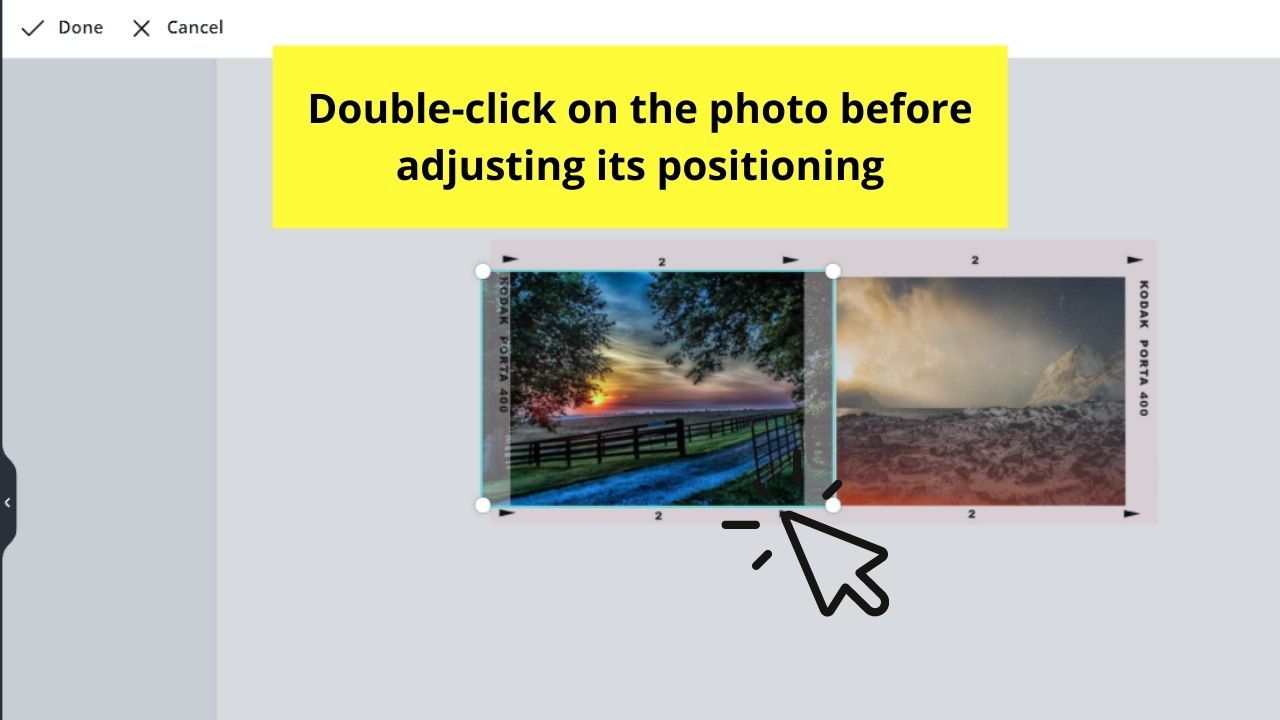

Drag the photo sideways to adjust it. Once you’re satisfied, simply tap outside the grid box or click on the “Done” button to save the changes made.
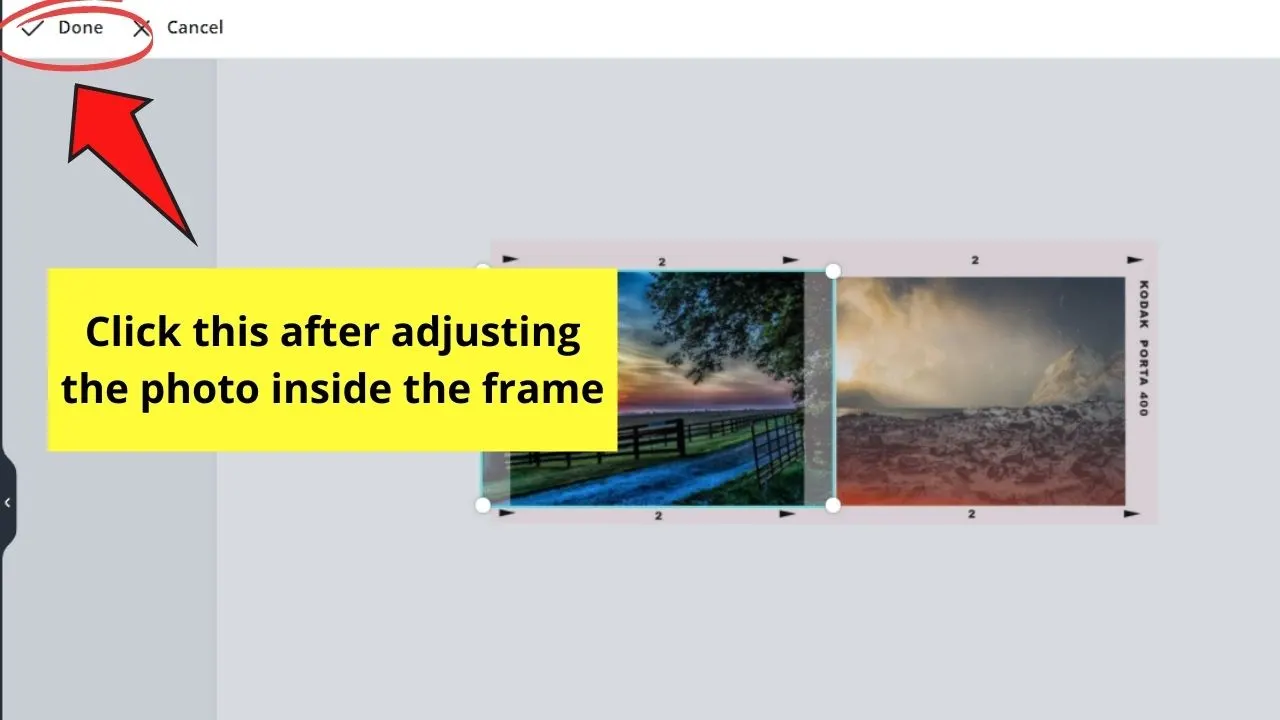
For videos, click on it and tap the crop icon (the scissor shape on the editor toolbar) to adjust the part of the footage you’d like to feature inside the frame.

After learning the basics, it’s time you get started on how to change the shape of a photo in Canva, how to make a picture round in Canva, and most importantly, how to use frames in Canva.
These 3 texts will guide you in detail through the process of using Canva frames.
Grids
Last, but not least of the key Canva elements are the grids. With Canva grids, they allow you to fit or stretch photos across the entire page.
So, if you’ve got several images that you’d like to put together on the canvas without them overlapping each other, grids got you covered on this.
But, it’s also possible to add more than one grid to the page (depending, of course, on the space left on the canvas) to make it look like an organized scrapbook.
To start using grids…
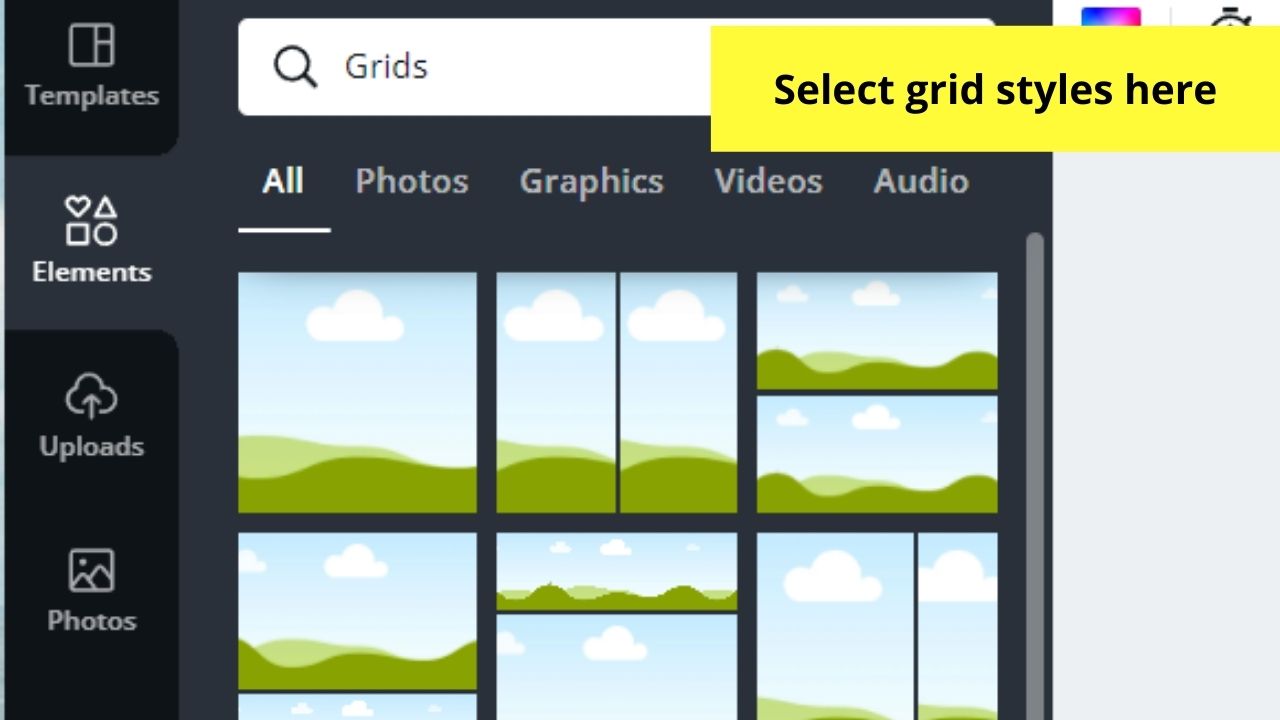
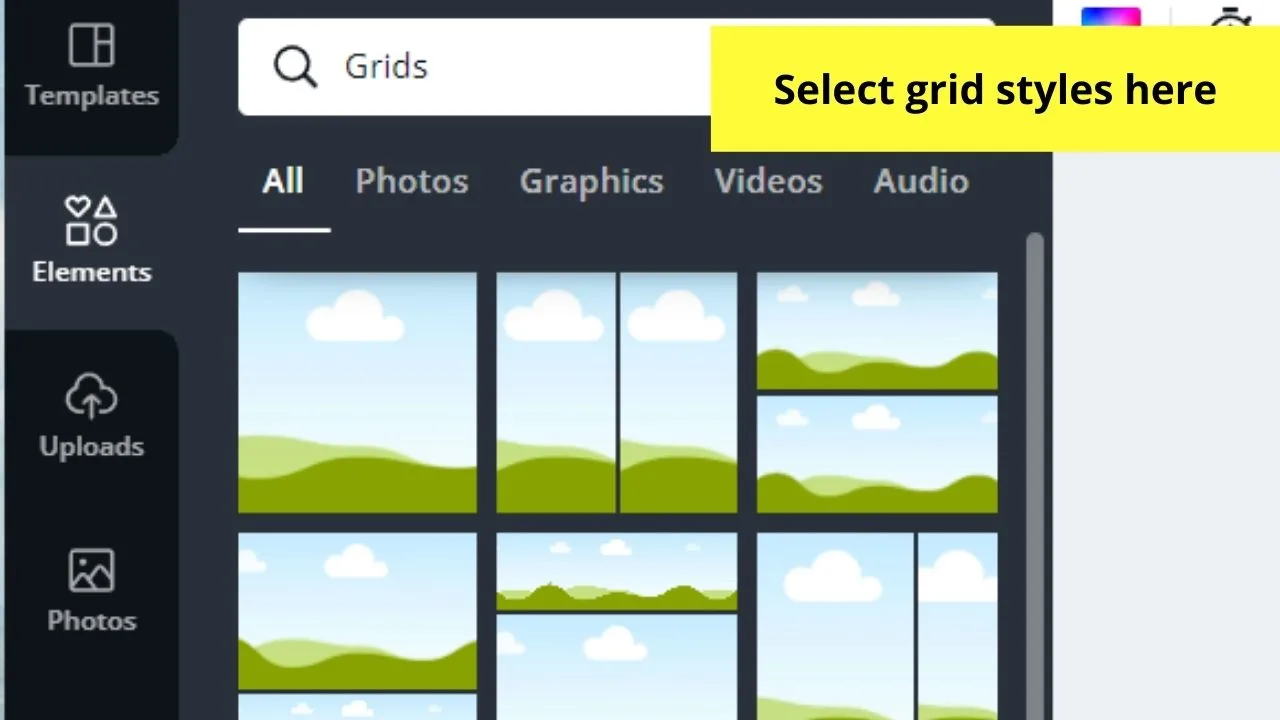
Step 1: On the elements menu, scroll down until you see the “Grids” section. Click on it to view the entire grids gallery.
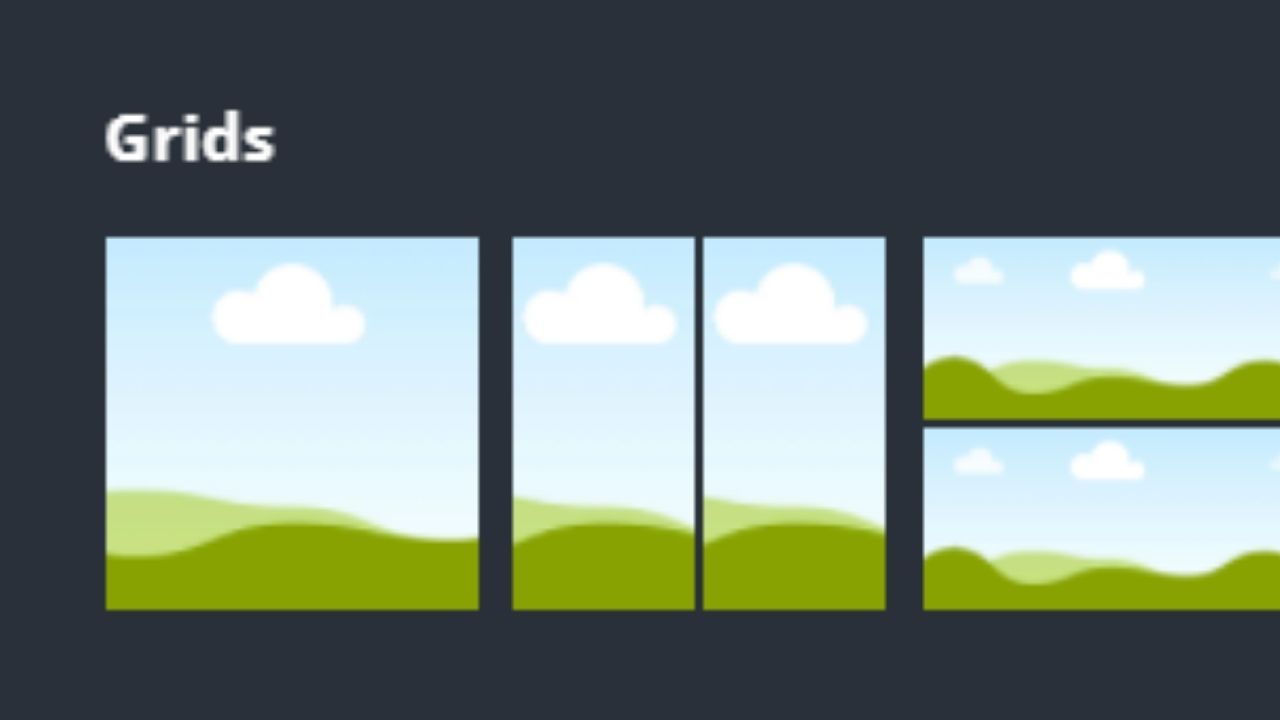

Step 2: Choose the grid layout you’ll use by clicking or dragging it towards the canvas.
If you want to add additional grids, you can do so by repeating the process until you got what you needed for your design.
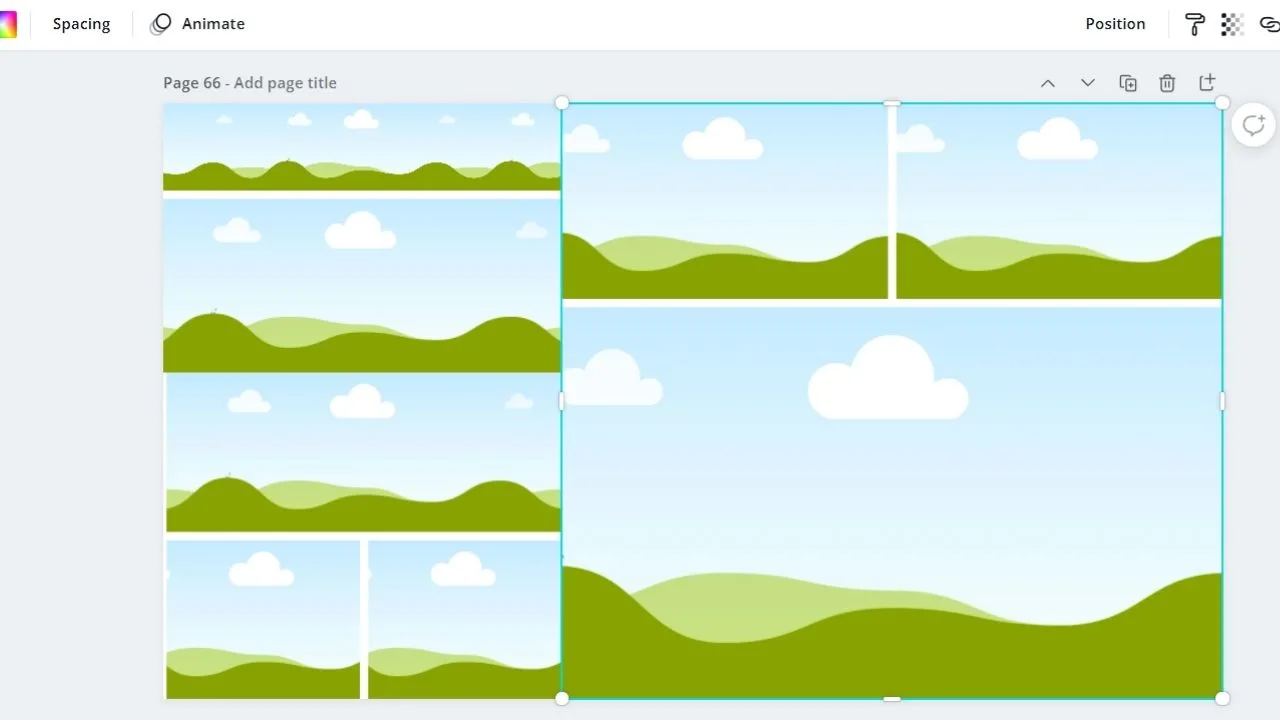
Step 3: If you’re using a single grid, it will automatically fill up the entire page.
For multiple grids to fit on the same page, simply drag the white handles on their corners and resize accordingly.
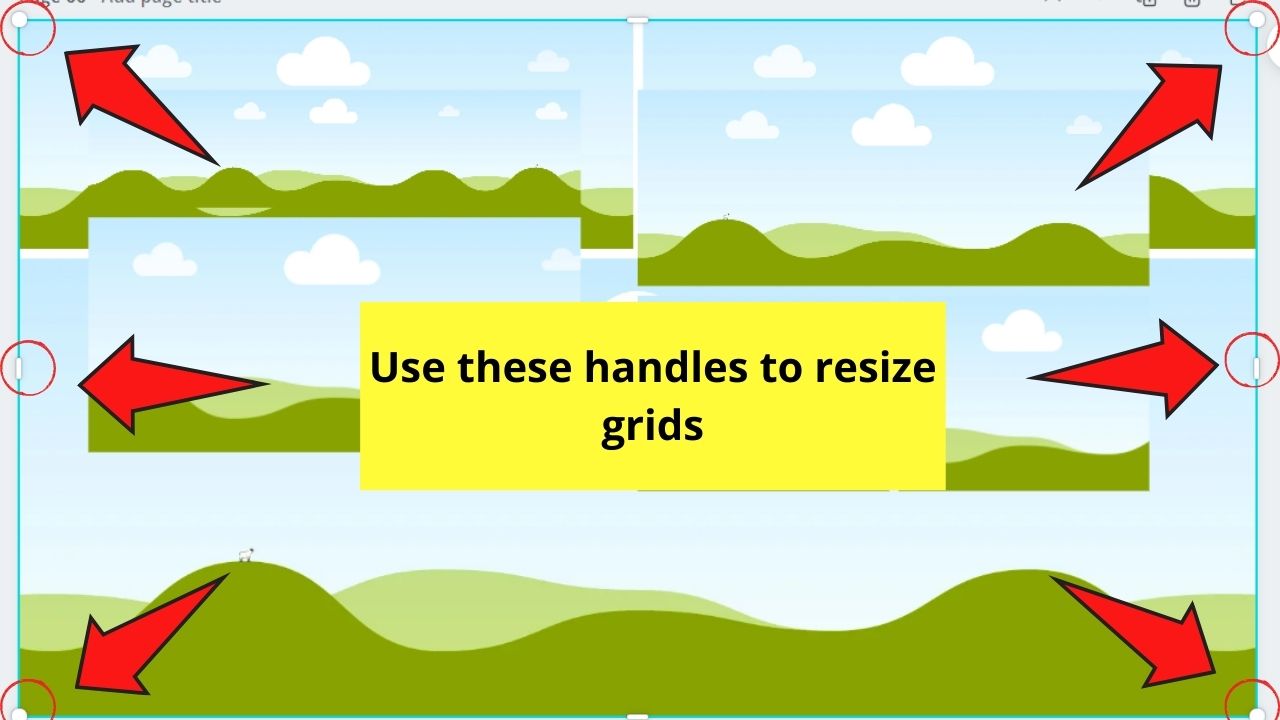
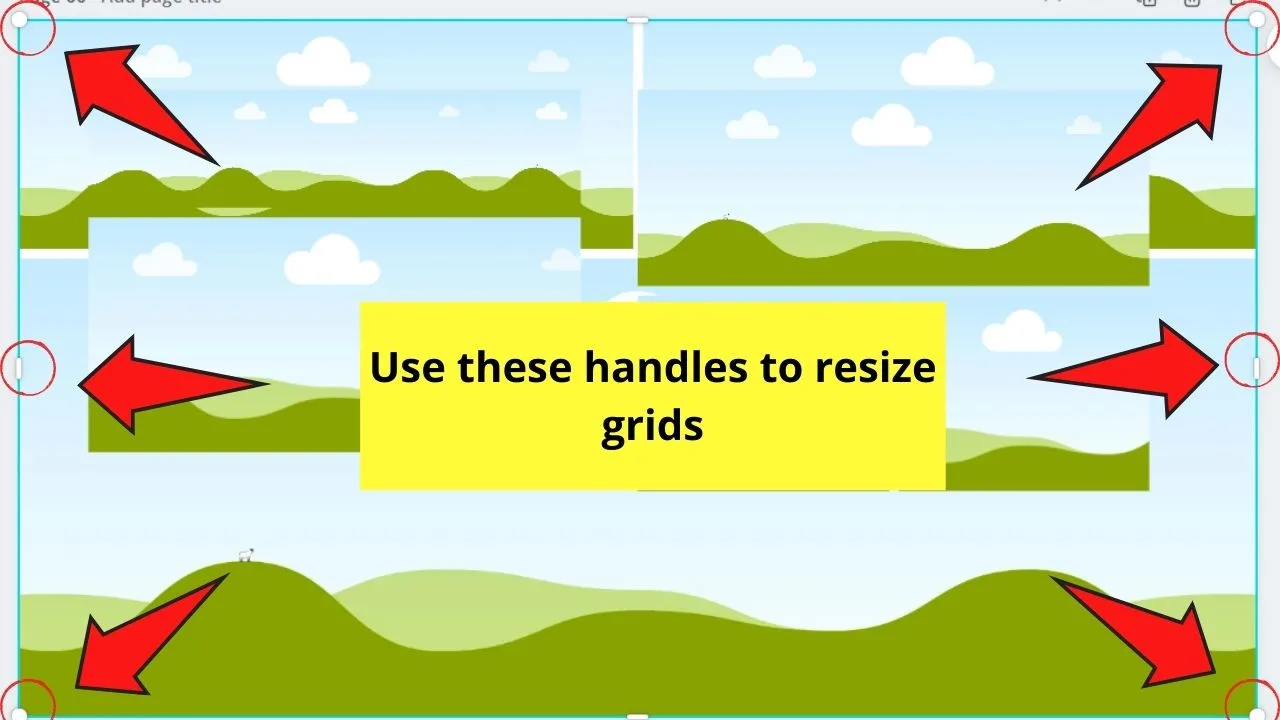
Then, arrange the grids artfully.
Step 4: Add images to your grids by choosing from Canva’s stock photos in the Photos gallery.

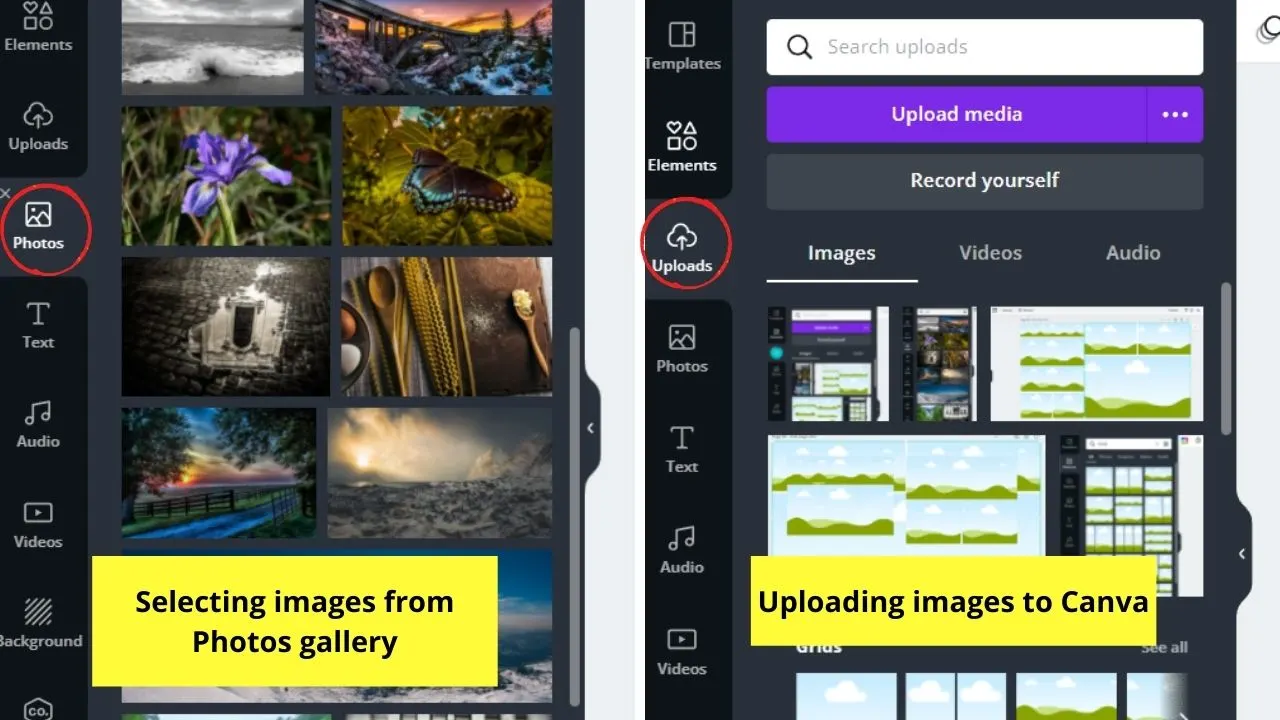
You can also upload personal images through the “Uploads” button.
Adjust the crop positioning of the photos by double-clicking on that particular grid. Repeat the crop positioning steps you’ve learned in frames here as well.
Step 5: To add colors instead of images, simply tap on the grid you’d like to fill in with color.
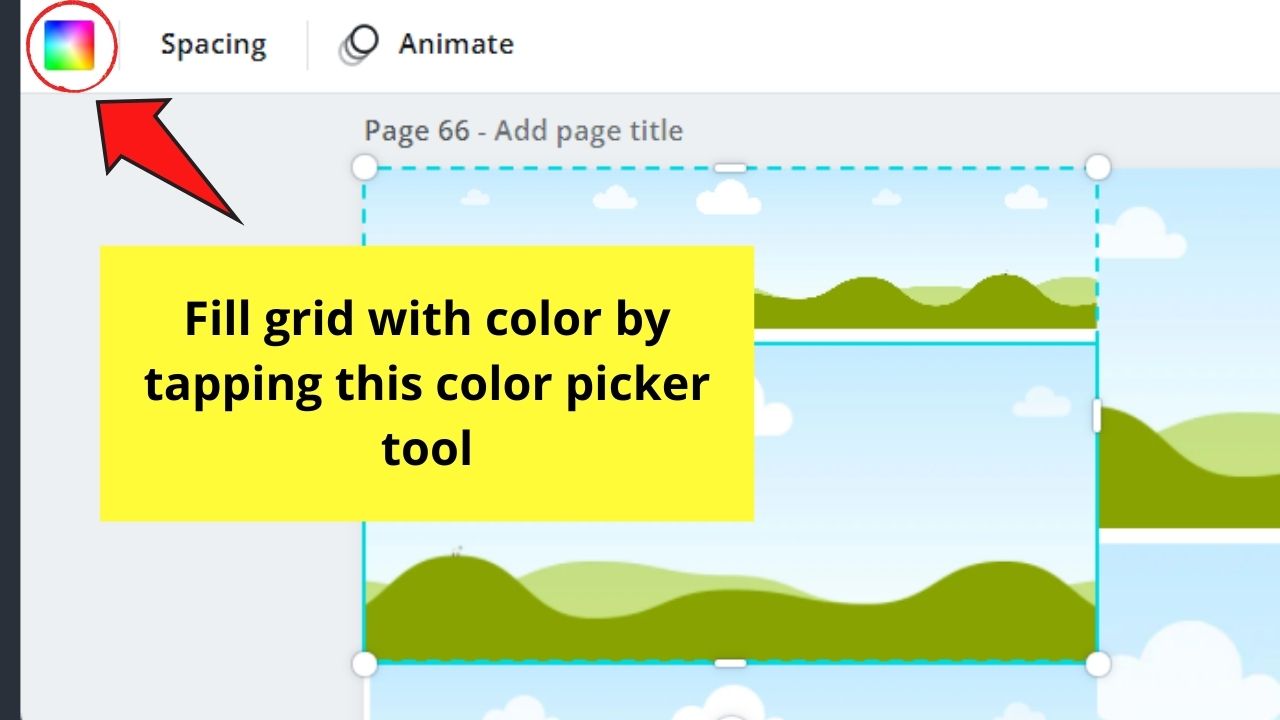

Then, head to the editor toolbar and click the color picker box. Select from the gallery the color you’ll use.
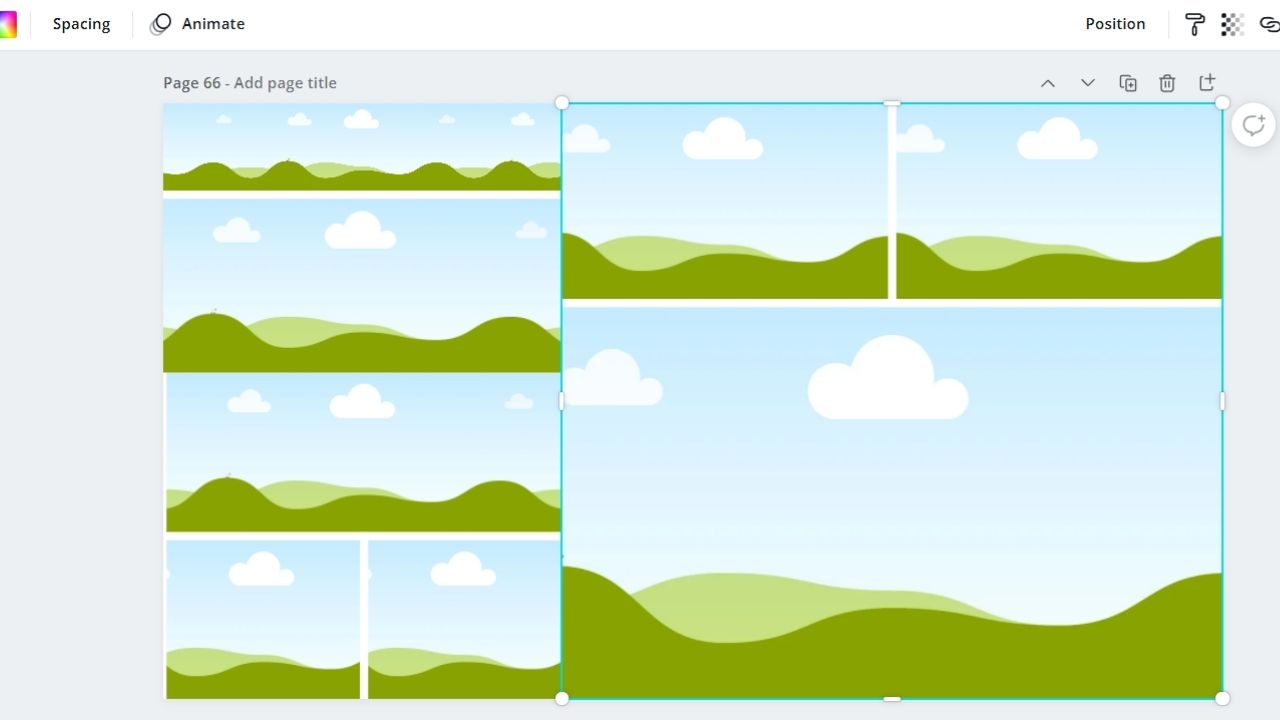
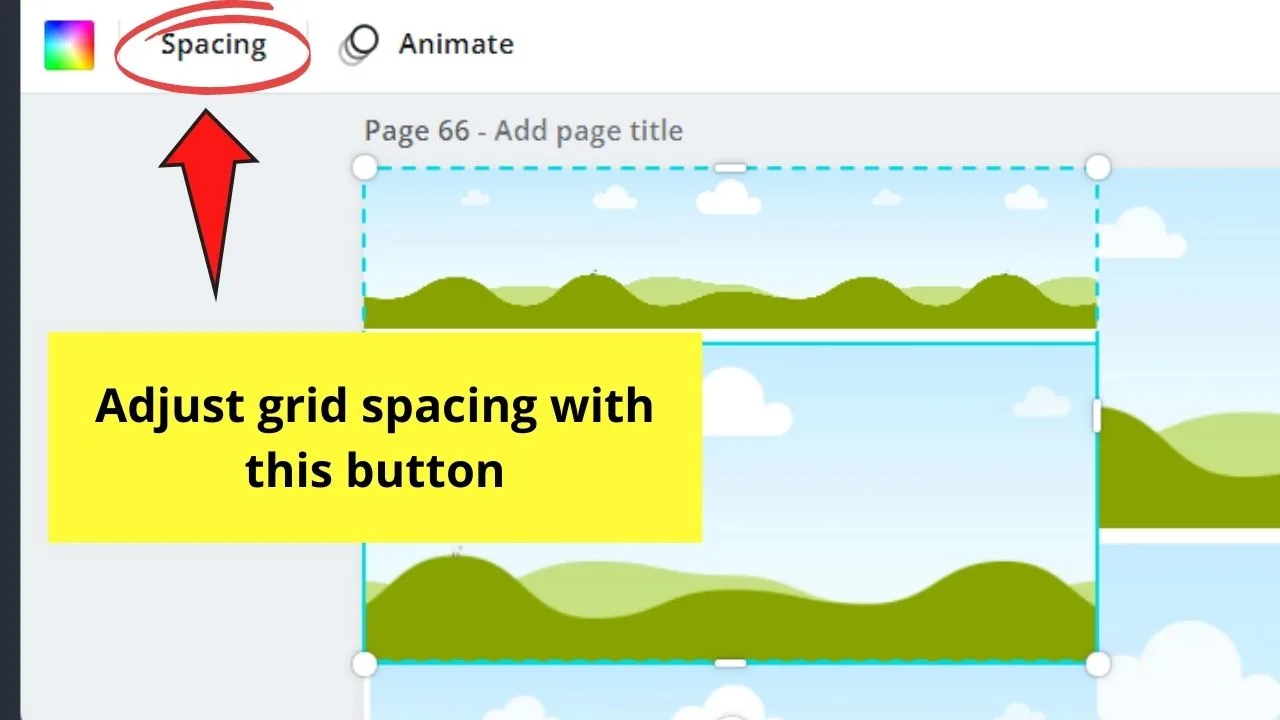
If you want to adjust the grid spacing, simply tap on the Spacing button and drag the slider to increase or decrease the space between the grids.

Simple, right? So, if you’re excited to use grids, you can take a peek at how to make a vision board in Canva.
There you’ll see how to maximize the use of grids for creating your vision board artistically.


Hey guys! It’s me, Marcel, aka Maschi. On MaschiTuts, it’s all about tutorials! No matter the topic of the article, the goal always remains the same: Providing you guys with the most in-depth and helpful tutorials!