It turns out you have an important meeting coming up, and you need to finish that presentation right away!
But, after taking a quick look at it, you realize how dull it is and you are worried that everyone in the meeting will fall asleep.
Adding visuals to a boring presentation is the best way to make it more engaging and alive. So, if that’s the case, you’ve come to the right place.
Don’t worry, no Excel or Power Point needed, today you’re going to learn how to make a pie graph on Adobe Illustrator. It’s a game-changer!
Adobe Illustrator happens to have these amazing and intuitive graph tools that can help you create anything! And trust me, it will make your boring data look much more fun to read.
How to Make a Pie Graph in Illustrator
To make a pie graph in Illustrator choose the “Pie Graph Tool” located on the toolbar. Click and drag to draw a rectangle with it and fill the graph data into the “Pie Graph” menu box. You can create one or multiple graphs (= one graph per row).
Making one of these pie charts is a simple task that will only take you a few minutes, I promise! And the best part is that you don’t even have to open Excel!
Before we continue, I’d like to point you that by default, Adobe Illustrator colors all graphs on a grayscale.
That’s so depressing, I know! However, once you learn how to use it, you can customize the graphs in any style you want by using any of the other Adobe Illustrator tools you like; the options are endless!
It’s possible that you won’t be able to locate a tool on your toolbar right away, but don’t worry, because you can personalize your toolbar and add any missing tools you need by just clicking on “Edit toolbar”.
You can find this option by heading to the three dots at the bottom of the toolbar. A list will appear, and you can select the “Pie Graph Tool” and any other tools you want to add by dragging them onto your toolbar.
How to Make a Pie Graph in Illustrator: Step-by-step Guide
Step 1
Create a new file.
Without this step, it would be impossible to follow the next steps.
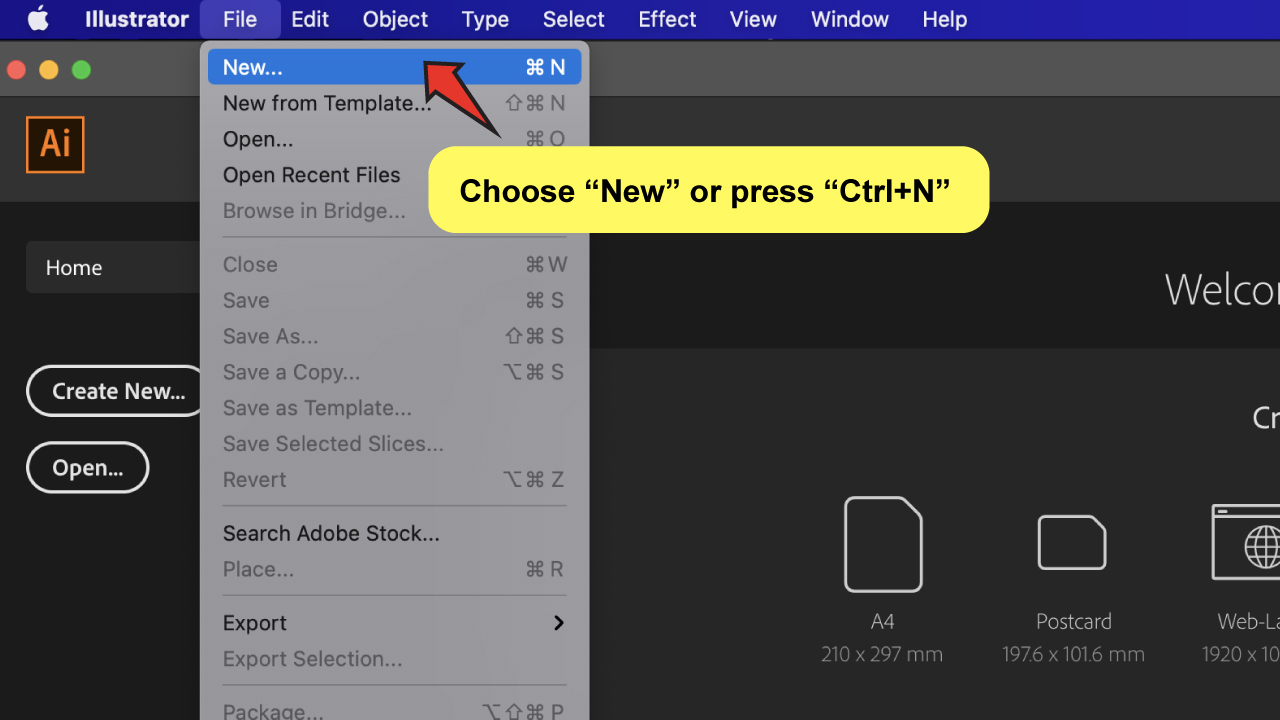
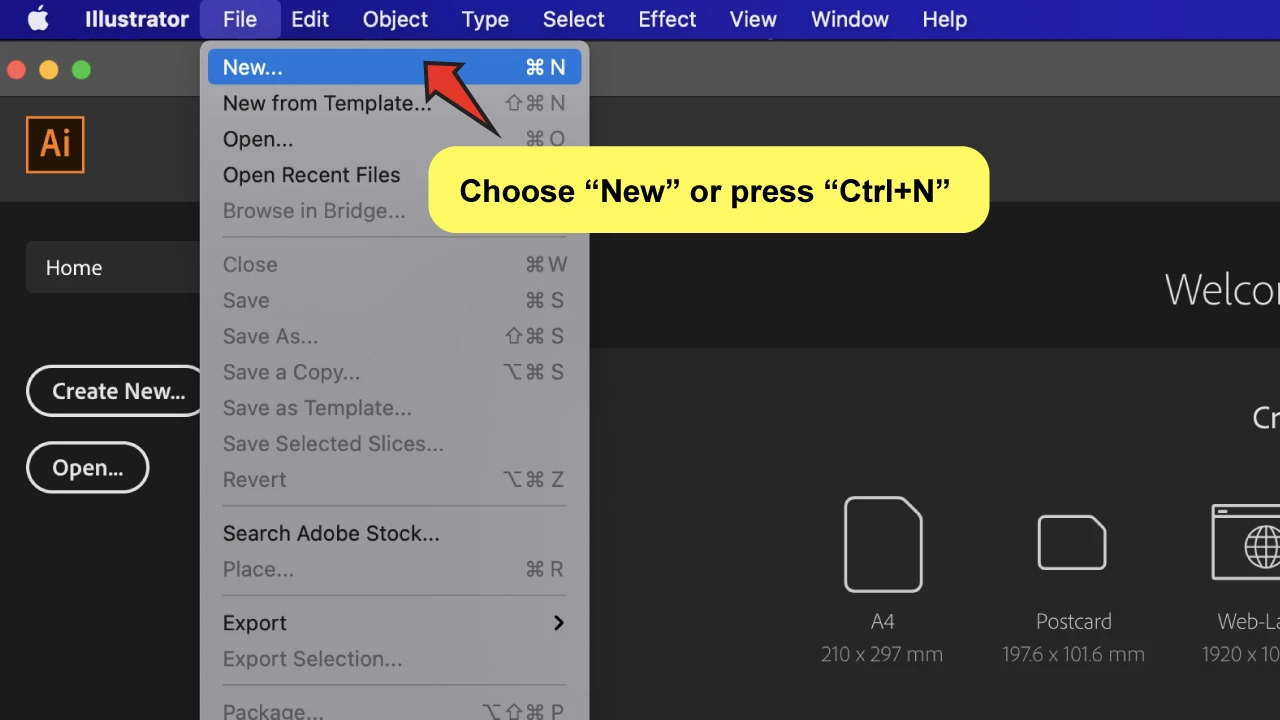
Go to “File” on the top menu, and then “New”, or just click “Ctrl + N” (“Command + N” if you’re a Mac user)
Step 2
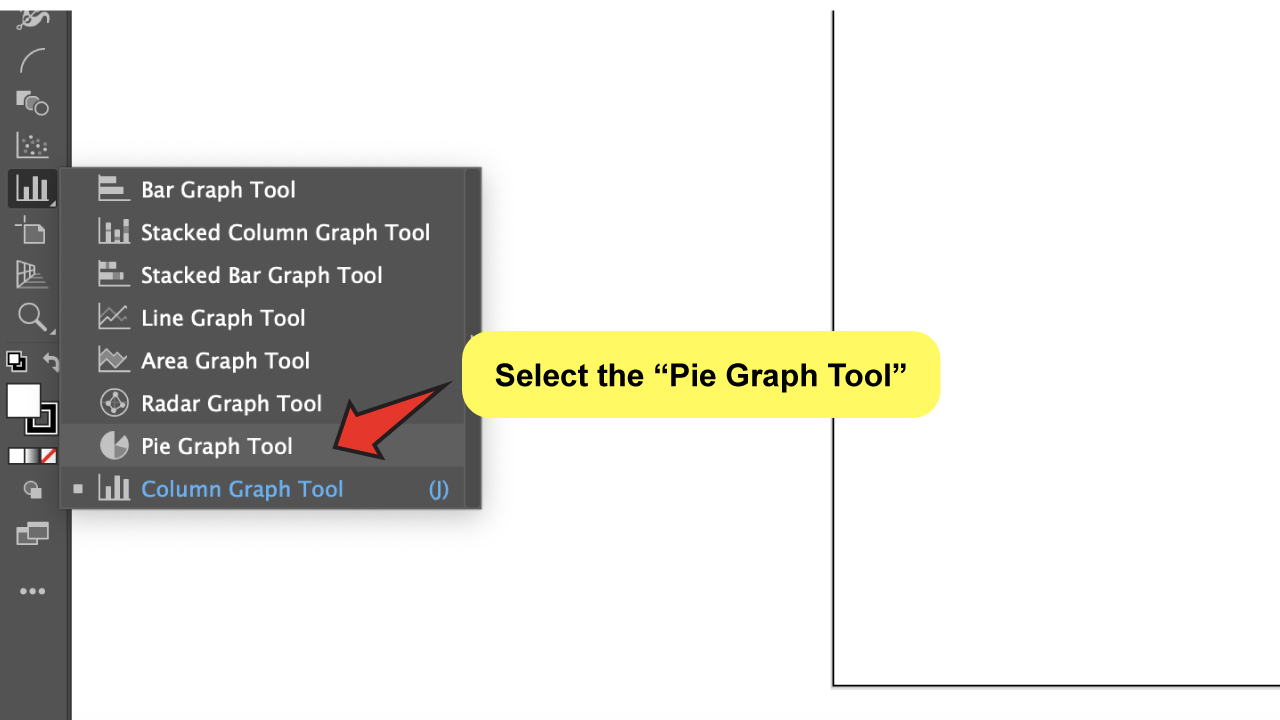
Select the “Pie Graph Tool”.
You can normally find it under the “Column Graph Tool” on the left toolbar.
So click on this tool and hold. A drop-down menu will appear to the right, from which you can pick the “Pie Graph Tool.” It should be easy to discover because the icon looks like a pie graph!


Step 3
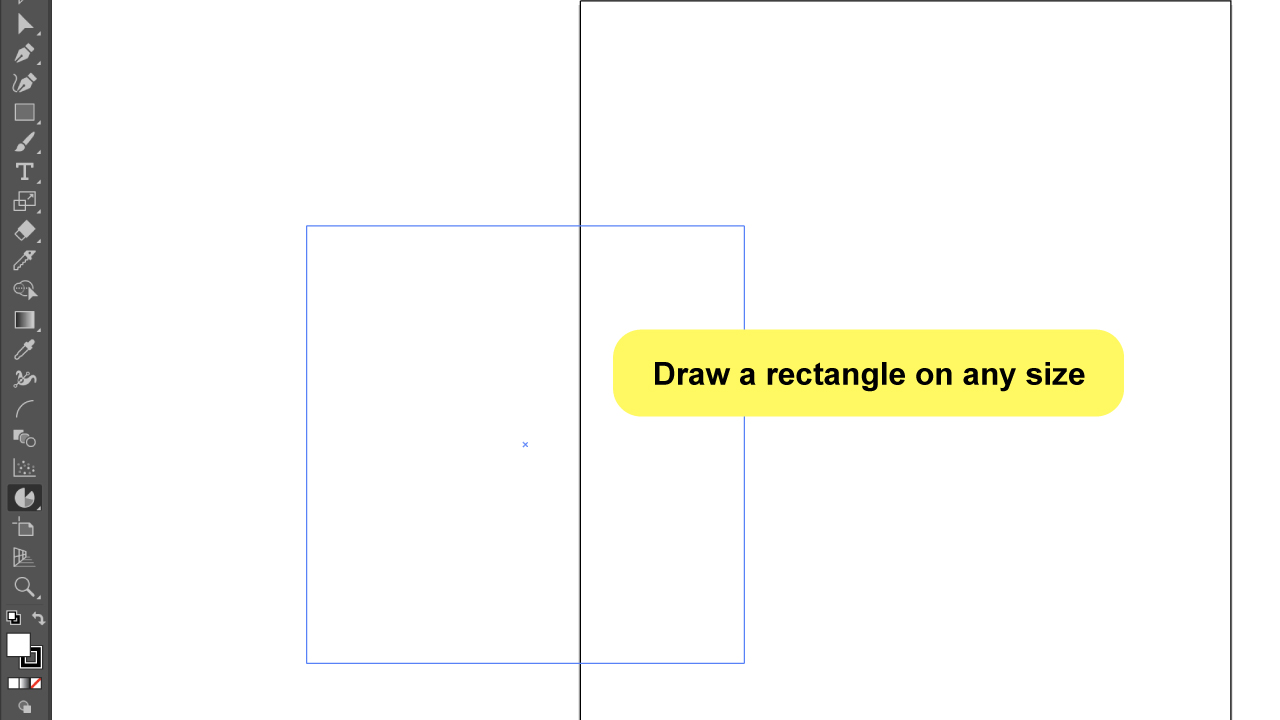
Create the pie graph.
Yes, the moment is here, this is your first pie chart in Illustrator. What a thrill, right?! There are two methods to this. Simply create a rectangle in any size you like.
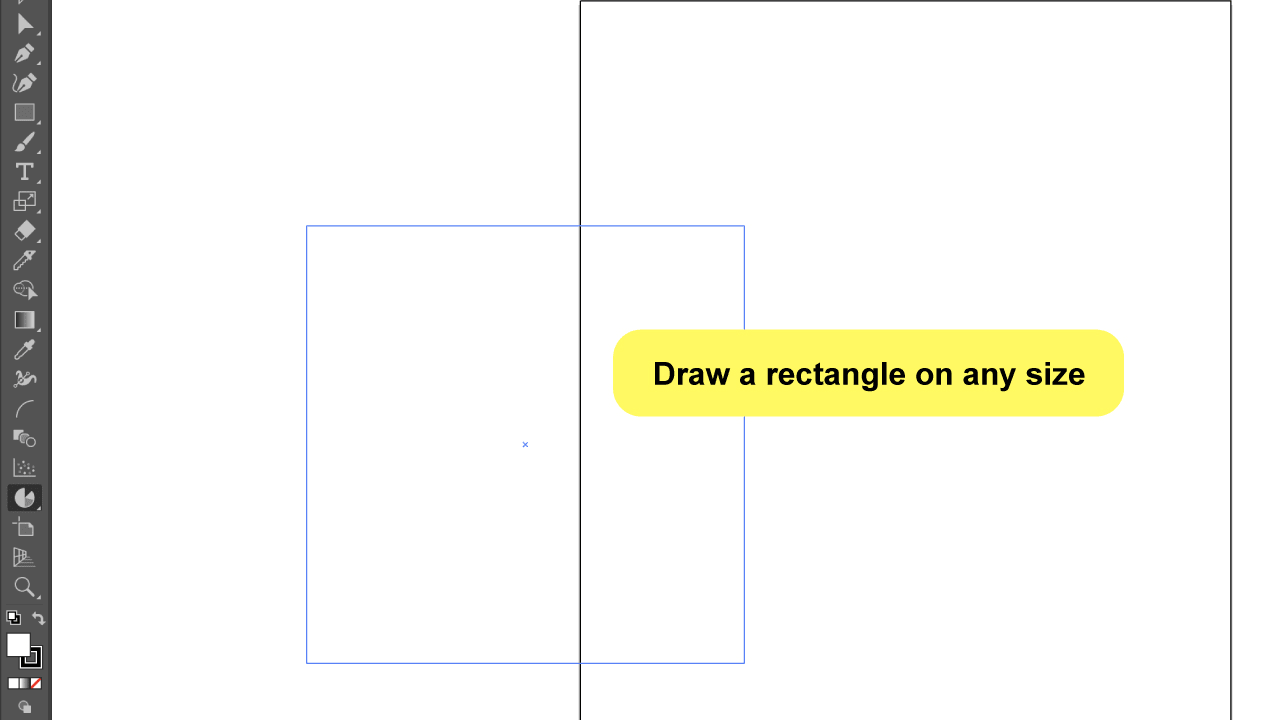
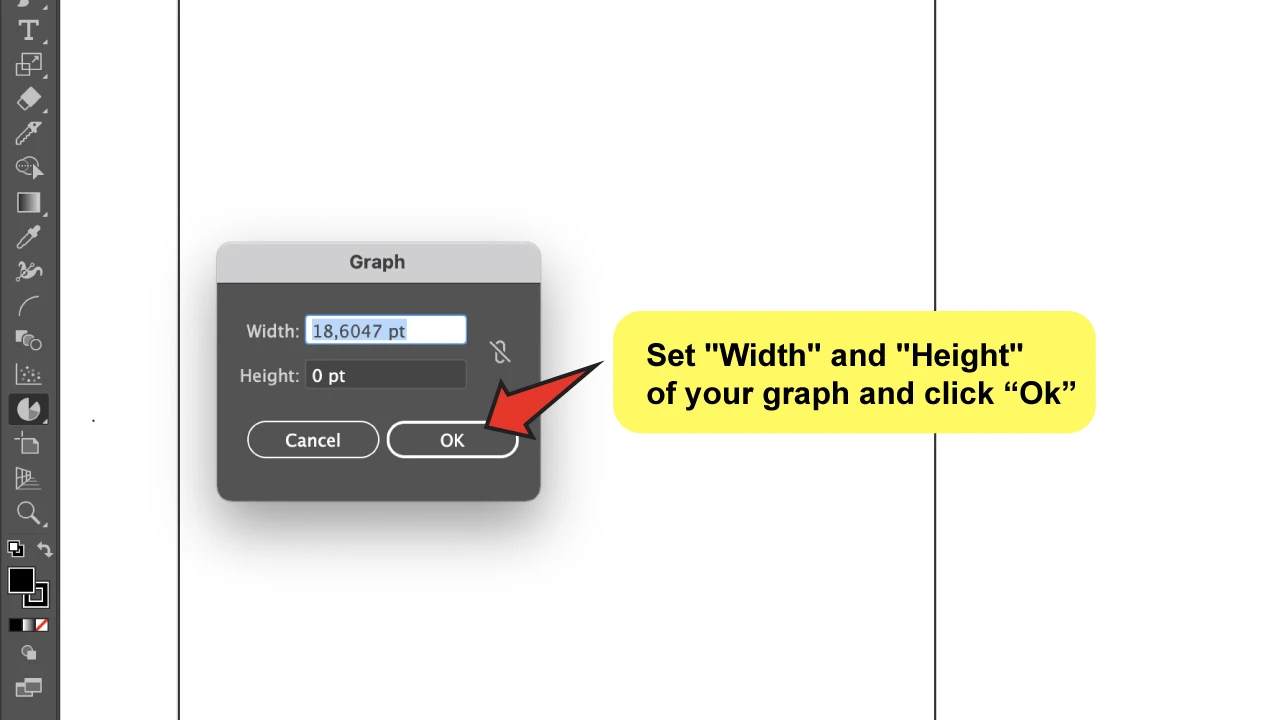
Or you can also do this by just clicking on canvas. Then, you will see that a “Graph” menu box appears, where you can configure the “Width” and “Height” of your graph.
If you have a precise size in mind, this is quite beneficial. But don’t be too concerned! Because you can resize your graph as many times as you like once it’s created.

Step 4
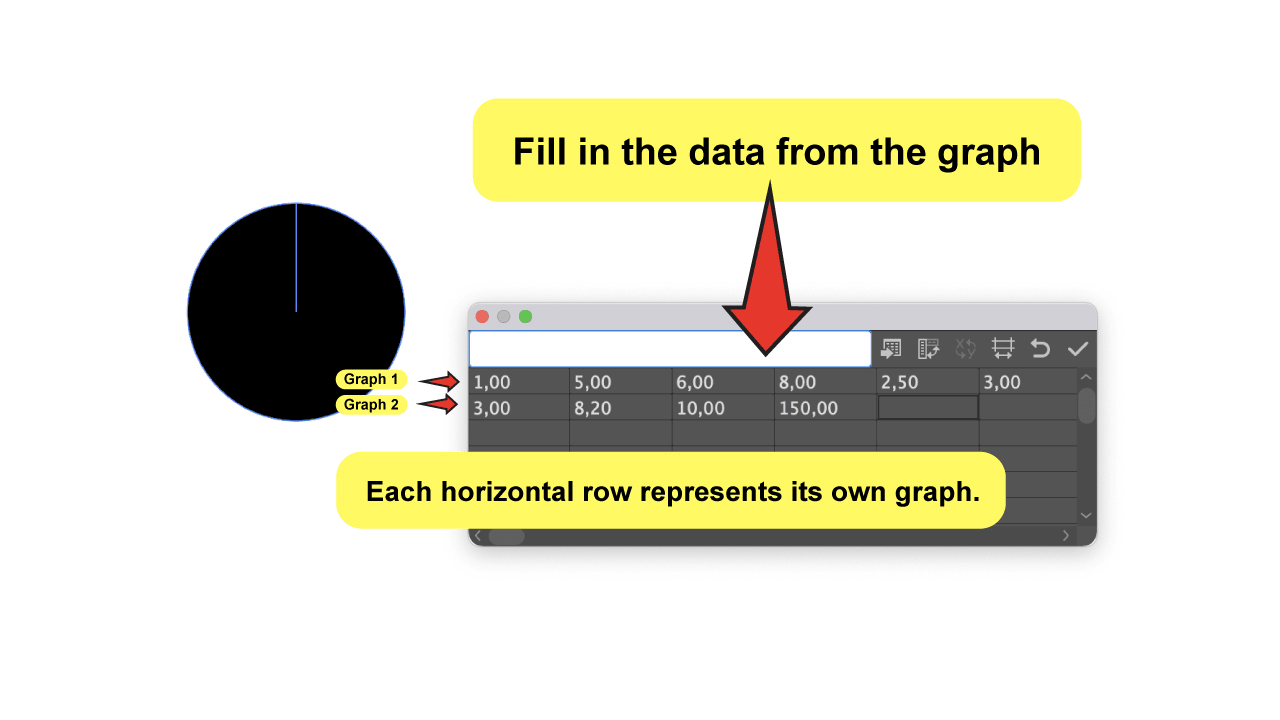
Fill in the data from the graph in the menu box.
Now it’s the time to write down the numbers! Each horizontal row in this menu box represents its own graph.
So, in general, the graph will be split into segments that represent percentages. And, regardless of how many there are, each field on the row will represent a slice of the pie.
That means that if you want to create more than one graph at a time, each new graph data must be placed in its own unique row.
Do you get it? It’s not hard at all! If you want to move things along quicker, just press the “Tab” key after each number.

Step 5
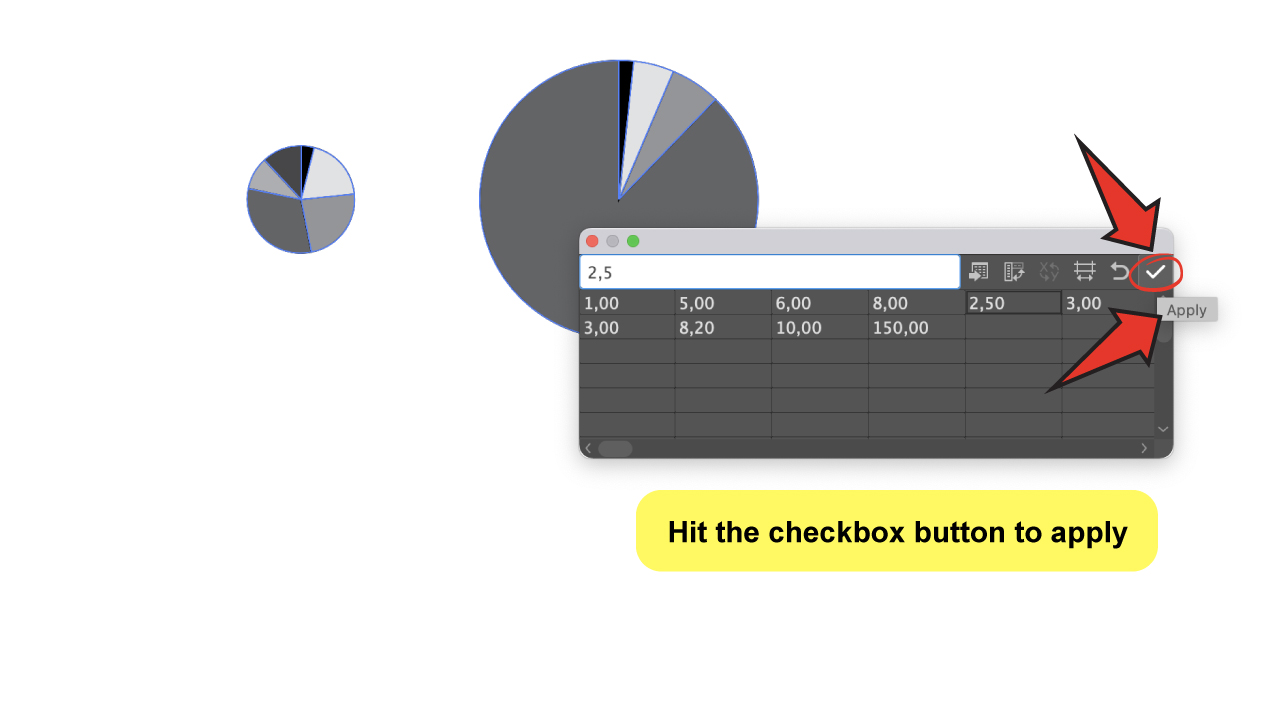
Hit the checkbox button to apply the data.
Once you’re done placing the numbers, you can apply the changes by just hitting the checkbox button.
Ta-dah! Do you smell that? Is the pie, it is already baked!
Sure, it looks dull and sad, but you can dress it up however you want after.

Step 6
Ungroup to customize.
Once you’re done creating the graph, you will probably want to customize it.
But in order to do that, you’re gonna have to ungroup it first.
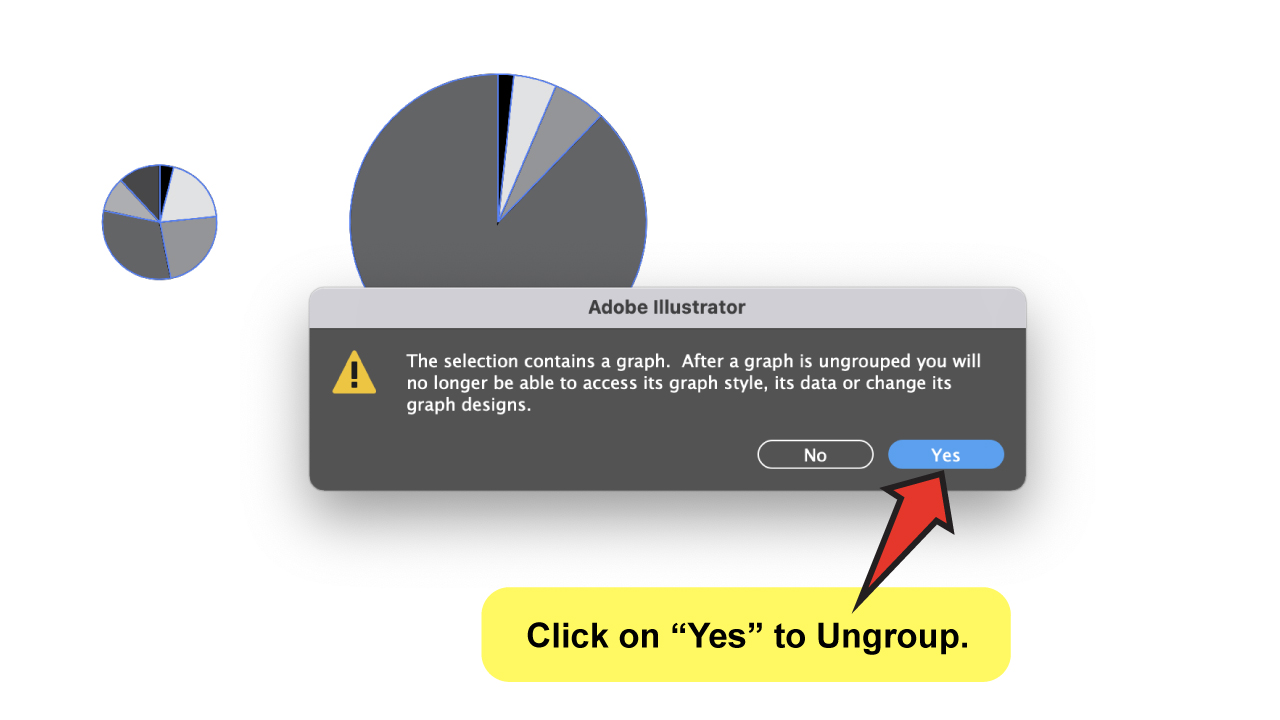
But wait a second! Because ungrouping the graph will convert it into a regular group of paths, just as any other object. This means it will no longer be a “Graph”, and you won’t be able to edit the data inside of it, the style, or the type of graph anymore.
So, after you made up your mind, click “Control + Shift + G” (or “Command + Shift + G” if you’re a Mac user) to ungroup. A pop-up window will appear, asking if you want to proceed. So all you have to do is click “Yes,” and you’re free to handle your object however you like!

Frequently Asked Questions About How to Make a Pie Graph in Illustrator
Can I put a name to my pie graph in Illustrator?
Yes! Turns out you can actually add a name to it by filling in the first field in the row with it. After you applied the data, the name will appear below the graph. Once you ungroup everything, you can edit that text and choose the font you want.
Can I resize my Illustrator pie graph?
Of course! Select the graph and press the “S” key on your keyboard to use the “Scale Tool”. You can now simply click on the object with it and drag to scale.


Hey guys! It’s me, Marcel, aka Maschi. On MaschiTuts, it’s all about tutorials! No matter the topic of the article, the goal always remains the same: Providing you guys with the most in-depth and helpful tutorials!